
Fig. 12.
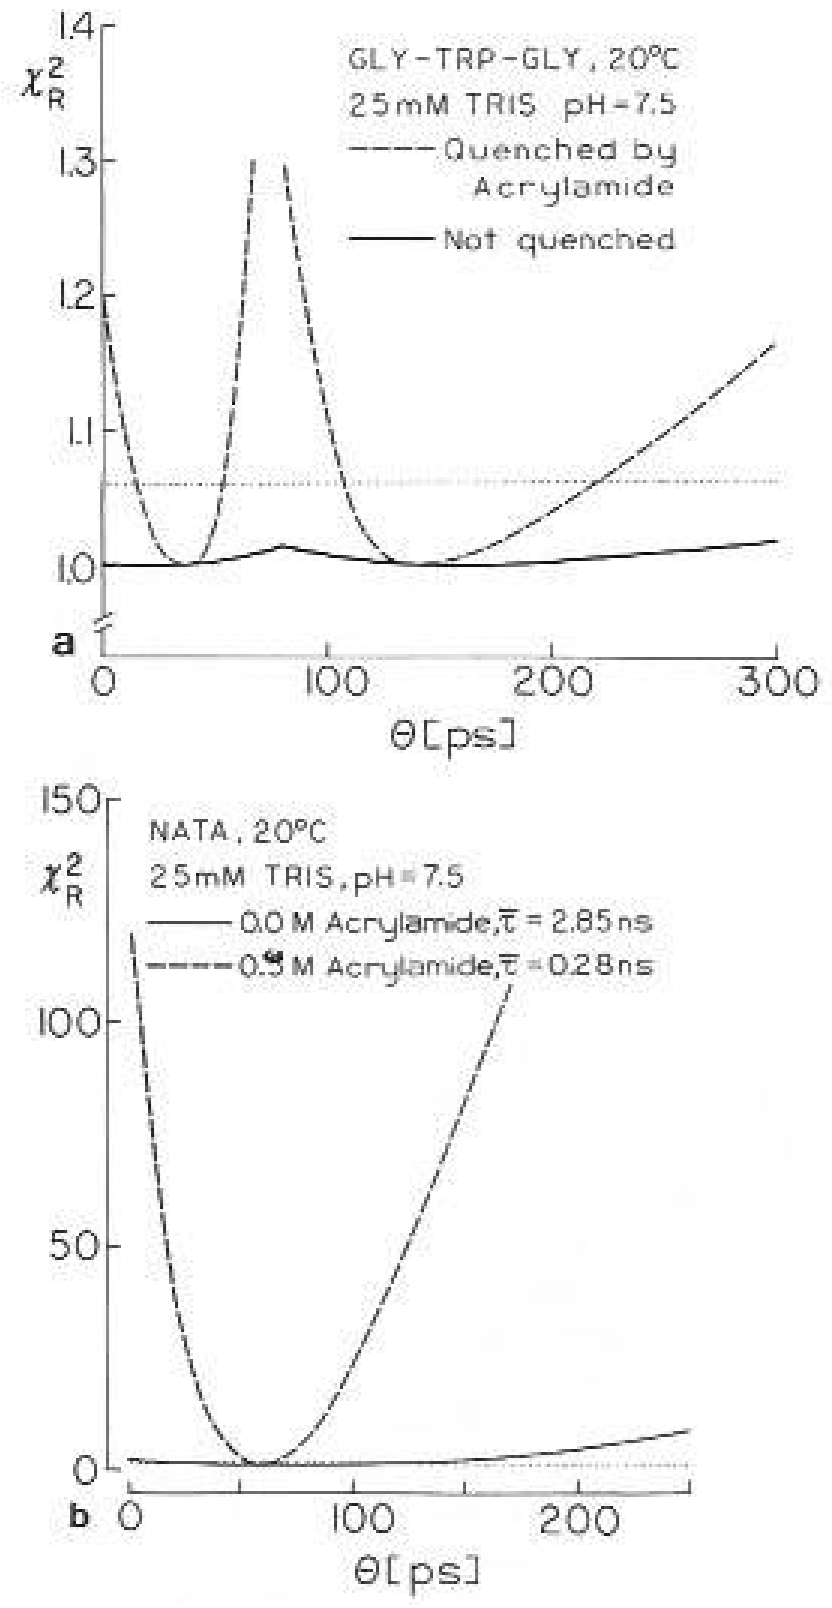
surface for the correlation times of Gly-tyr-gly (a) and of NATA (b) in aqueous solution at 20°C. The solid lines are for the unquenched samples, For gly-trp-gly (a) dashed lines are the values for global analysis of data for 0.0, 0.3 and 0.7 M acrylamide. For NATA (b) the dashed line is for 0.5 M acrylamide. The horizontal dotted lines are the 67% confidence levels for for the quenched samples