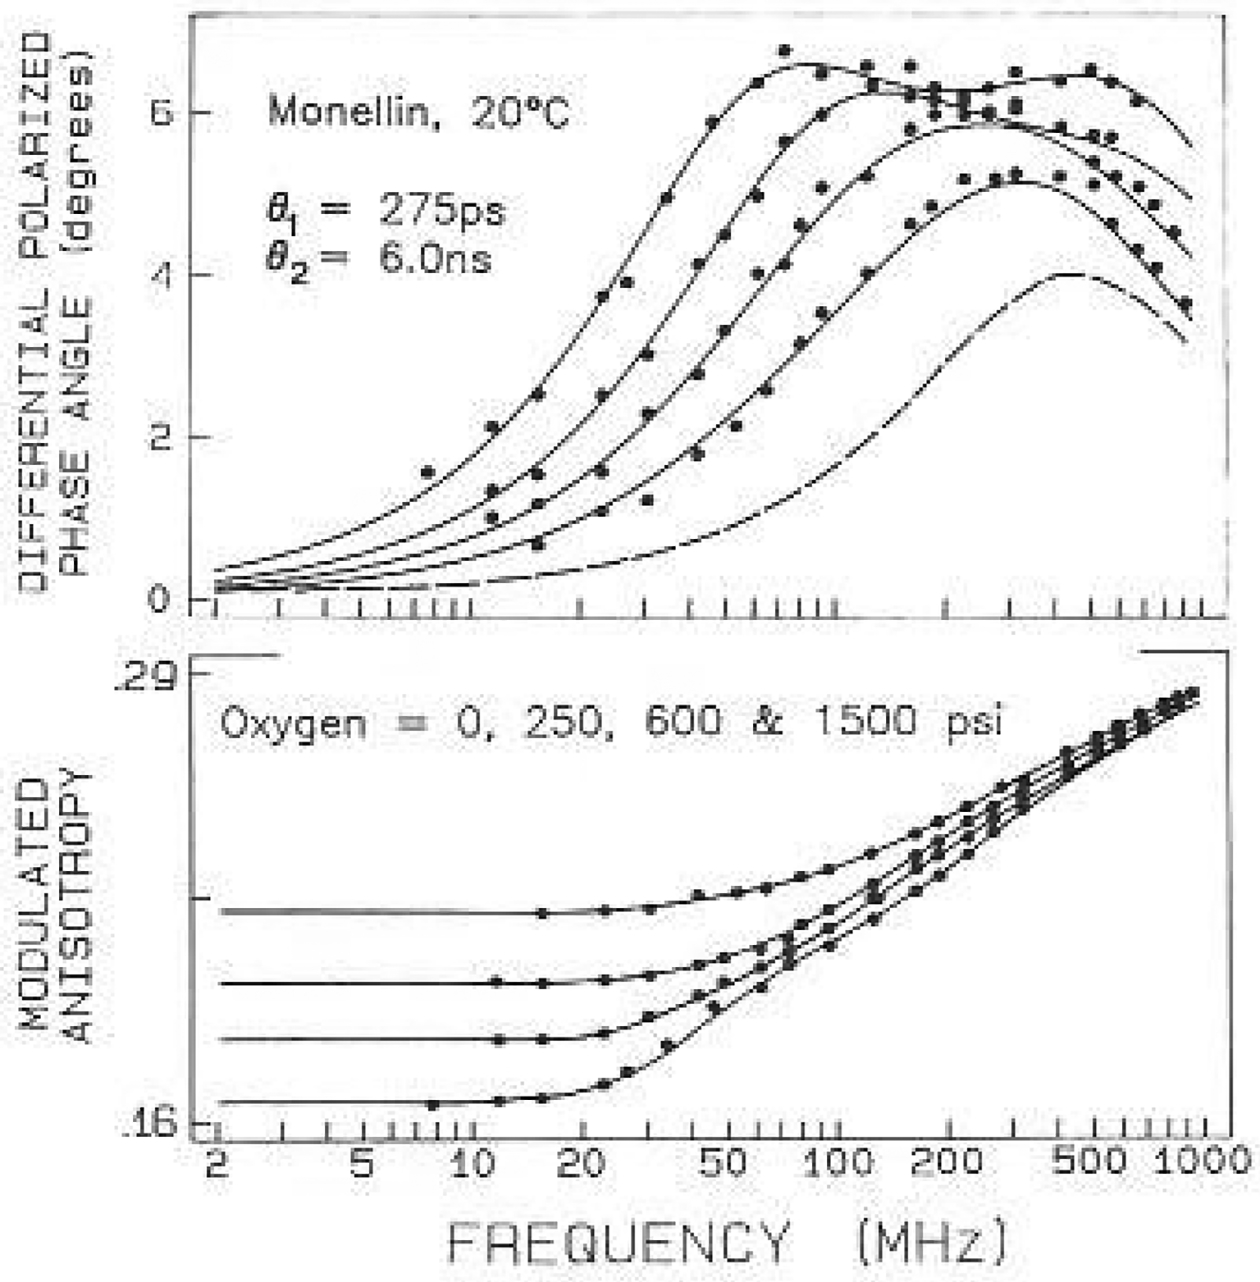
Fig. 5.

Frequency-domain anisotropy data for monellin with oxygen quenching. Data are shown for oxygen pressures of 0, 250, 600 and 1500 psi. The dashed lines show the values expected for a correlation time of 275 ps, with an amplitude of 0.075, and the three-component intensity decay for quenched monellin (Table 4, 0.144 M oxygen)
