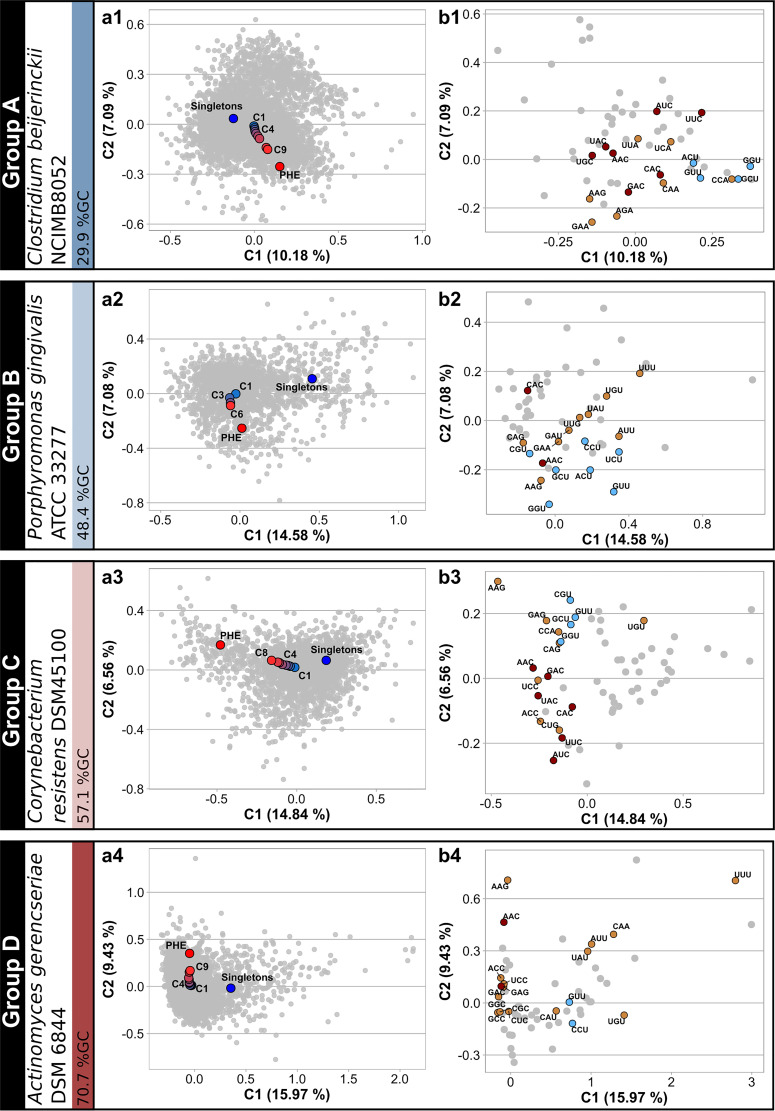
FIG 1.
Raw-codon-count-based correspondence analysis (CA) plots of core-gene sets with different degrees of conservation throughout the phylogeny of selected prokaryote families (groups A to D). (a1 to a4) In 4 reference strains with different GC contents, individual genes (in gray) are represented in the space of the first-two CA components, with the percent variation of components 1 and 2 being indicated on the axes. CAs were computed using raw codon counts (RCC) as the input variables. Average coordinates (centroids) for different gene sets (i.e., singletons in blue, C1 to Cn in a gradient from blue to red, and putative highly expressed [PHE] genes in red) were projected on the CA space. In C1 to Cn, the higher number, the more ancestral the core gene set within the phylogeny. Table S1a (tab 1) lists the prokaryote species that were used to construct each Ci gene set by means of the EDGAR software (57, 58). (b1 to b4) Plots describing codon relative weight in the first two principal-component positions of the CA. Codons with the highest codon usage frequency (CUF) enrichment for each amino acid from C1 to PHE (i.e., those codons that better represent translational adaptation) are colored light brown, except when those same codons corresponded also to a 2-/3-fold C or to a 4-fold U bias, in which case they are colored dark brown and light blue, respectively.

