
FIG 2.
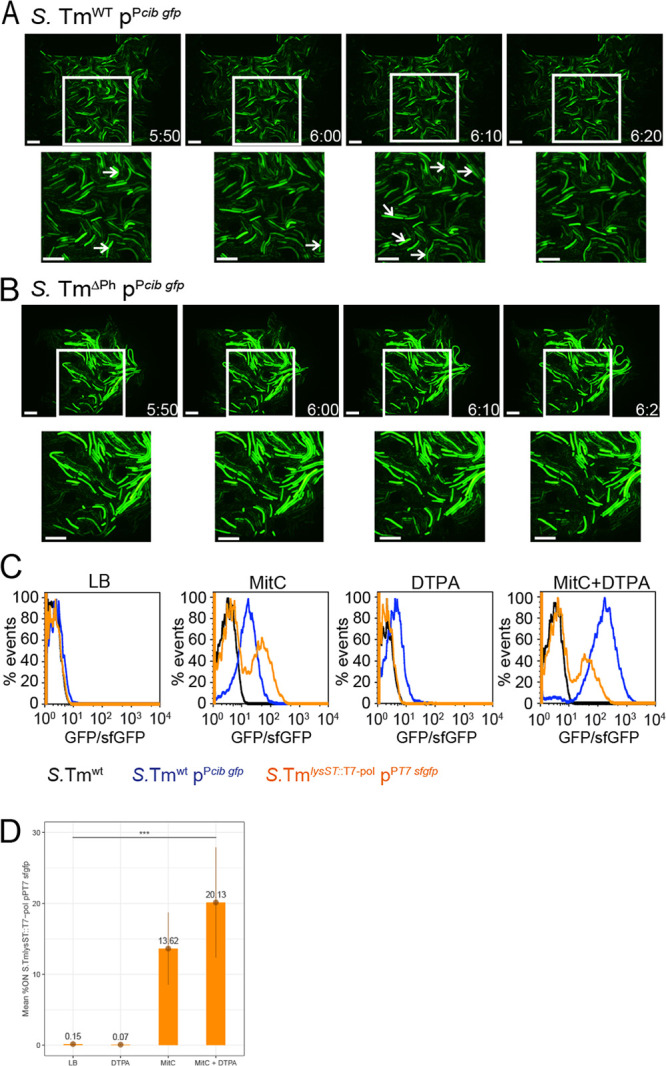
A fraction of the ColIb-producing S. Tm population simultaneously expresses ST64B prophage lysis genes. (A and B) Live-cell microscopy using the Onix microfluidic system (Millipore). Microcolonies of S. TmWT pPcib gfp (A) and prophage-deficient S. TmPh pPcib gfp (B) were cultured in microfluidic plates for 3 h in LB only. Subsequently, medium was exchanged with LB supplemented with 100 μM DTPA for 20 min to induce cib expression. Next, LB supplemented with 100 μM DTPA and 0.5 μg/ml MitC was applied to induce the bacterial SOS response and full expression of cib and induce the prophage(s). After 20 min, cells were again exposed to LB supplemented with 100 μM DTPA for the remaining time of the experiment. Microscopic images obtained by live-cell microscopy (GFP-channel only) of S. TmWT pPcib gfp (A) and prophage-deficient S. TmPh pPcib gfp (B) microcolonies. White arrows point to bacteria that are about to lyse. (C) S. TmWT pPcib gfp (blue) and S. TmlysST::T7 pol pPT7 sfgfp (orange) were grown in a 96-well plate in either LB with respective supplements (0.5 μg/ml MitC; 100 μM DTPA) for 4 h. Fluorescence signal intensities of GFP (cib) and sfGFP (ST64B prophage lysis genes) were determined by flow cytometric analysis, respectively. Background fluorescence signals of S. TmWT (black), grown under the same conditions, are shown as control. (D) Quantification of percent GFP (cib) “ON” cells from three replicate FACS experiments as described above for panel C.