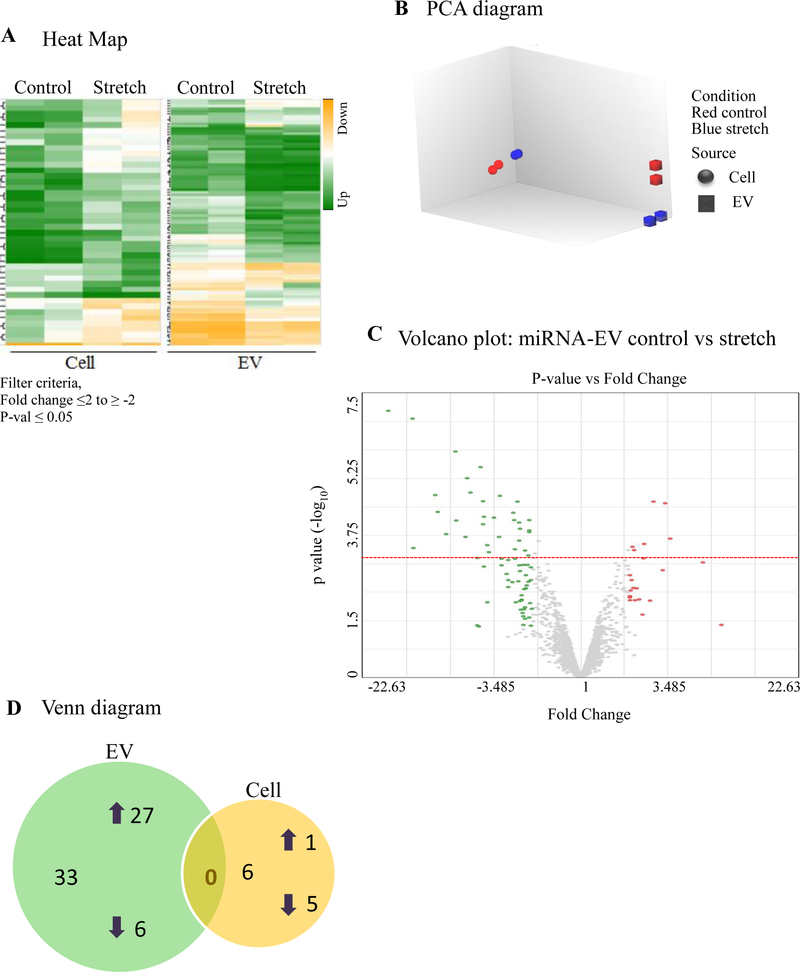
Figure 4: Effect of 5% continuous stretch on miRNA expression in EVs from lung epithelial cells.
MiRNA expression profile was generated by microarray assay, using total RNA extracted from EVs released from MLE-12 cells after exposed to 5% continuous stretch for 24 hours and controls (unstretched). (A) Heat map was generated using a clustering method in which miRNAs was grouped based on their similarity of expression patterns. Data are shown in a grid where each row represents a gene and each column represents a sample. Fold change for gene expression was set up at ≤2 to ≥ −2 and ≤ 0.05 for p-values. Green and yellow colors indicate up regulation and down regulation of miRNA expression, respectively. (B) Intrinsic cluster within the data set was shown by Principle Component analysis (PCA) graph. Samples are colored and shaped by experimental conditions and sources in which red-control, blue-stretch, circle-cell and square for EVs respectively. Each shape represents a single experiment. (C) Volcano graph demonstrates differentially expressed miRNAs with fold changes (x- axis) and statistical significance (-log10 of p value, Y axis). The dashed red line shows where p=0.05 with points above the line having p <0.05. Gray color points represent the miRNAs with fold changes < 2. (D) Venn diagram showing the number and overlap between differential expressed miRNAs identified by 5% continuous stretch in the EVs and cells.

