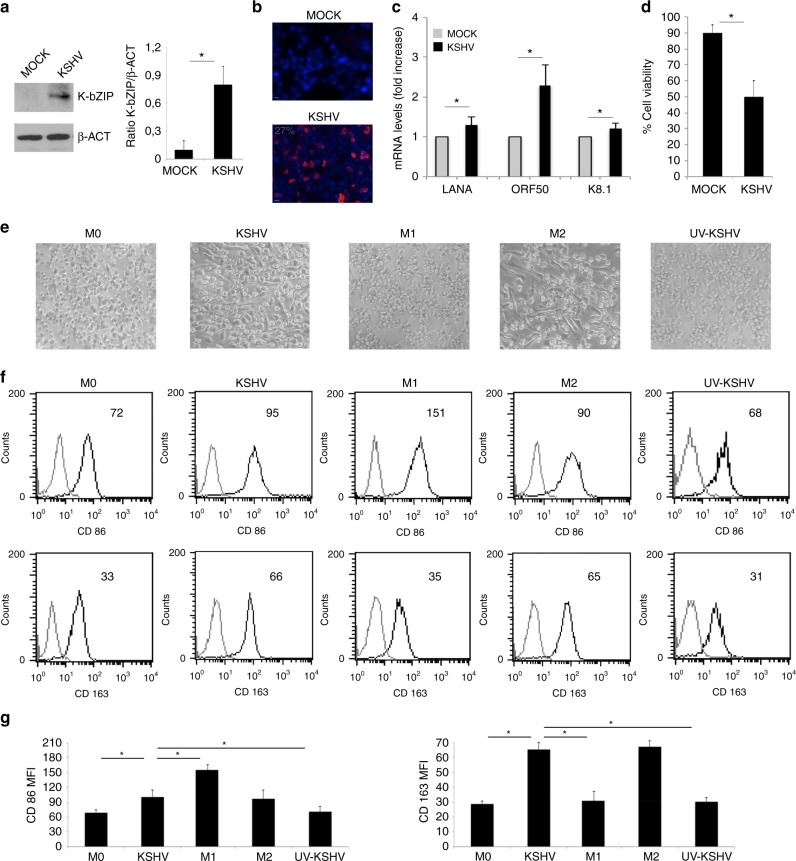
Fig. 1. KSHV infects macrophages and skews their phenotype towards an M2 phenotype.
a K-bZIP expression in KSHV- and mock-infected macrophages was evaluated after 24 h of infection by western blot and b the percentage of K-bZIP expressing cells was assessed by IFA. β-actin (β-ACT) was used as loading control. A representative experiment out of three is shown. Histograms represent the mean plus S.D. of the densitometric analysis of the ratio of K-bZIP/β-actin; c LANA, ORF50 and K8.1 mRNA were evaluated by qRT-PCR. The amount of target mRNA was normalised towards the β-actin gene and analysed by comparing mock and KSHV-infected macrophages. Data are plotted in histograms and standard deviation (SD)is also reported. *p-value < 0.05. d Cell viability of mock or KSHV-infected macrophages was studied by trypan blue exclusion assay. Mean plus SD of three independent experiments is reported. *p-value < 0.05; e Morphology of M0, KSHV-infected, M1, M2 and UV-KSHV-treated macrophages was observed utilising an optical microscope (×40 magnification); f FACS analysis of CD86 and CD163 expression of M0, KSHV-infected, M1, M2 and UV-KSHV-treated macrophages. A representative experiment is shown, and the mean of fluorescence intensity is indicated. Grey peaks represent the isotype controls. g Histograms representing the mean plus SD of CD86 and CD163 MFI (Mean fluorescence Intensity) are also reported. *p-value < 0.05.

