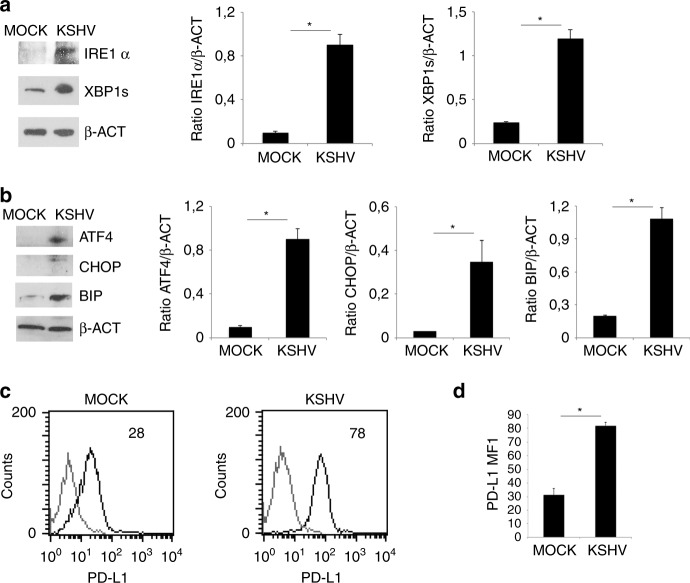
Fig. 4. KSHV activates UPR and up-regulates PD-L1 on KSHV- infected macrophages.
a Ire1α and XBP1s expression in mock- and KSHV-infected macrophages was evaluated by western blot analysis; b ATF4, CHOP and BIP expression in mock- and KSHV-infected macrophages was evaluated by western blot analysis. β-actin (β-ACT) was used as loading control. A representative experiment out of three is shown. Histograms represent the mean plus S.D. of the densitometric analysis of the ratio of each protein/β-ACT. *p-value < 0.05. c PD-L1 expression on mock- and KSHV-infected macrophages was evaluated by FACS analysis. A representative experiment is shown, and the mean of fluorescence intensity is indicated. Grey peaks represent the isotype controls. d Histograms representing the mean plus SD of PD-L1 MFI (Mean fluorescence Intensity) are also reported. *p-value < 0.05.

