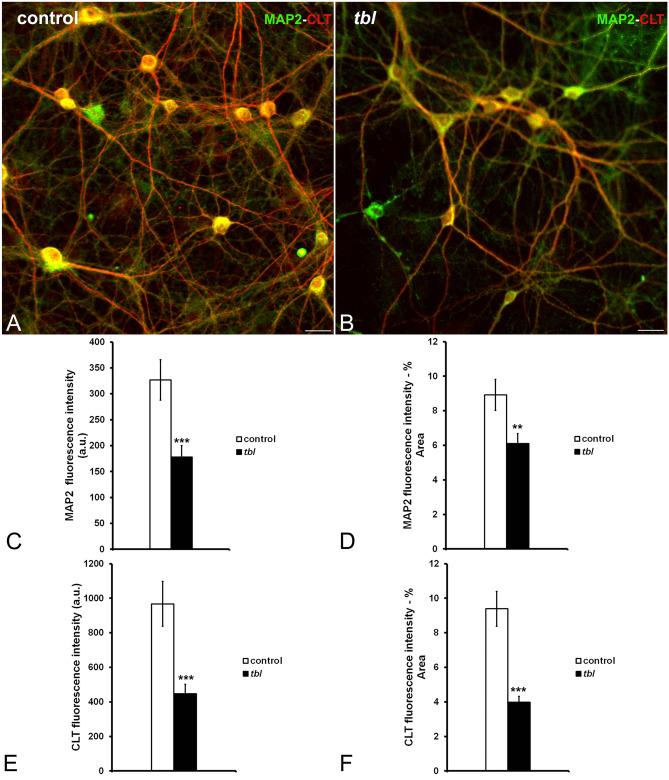
Figure 3.
Laser confocal microphotographs of hippocampal cultures from control (A), and tbl (B) mice illustrative of MPA2 (green) and CLT (red) immunocytochemistry. (C–F), graphical representation of the fluorescence intensities of MAP2 and CLT in absolute values per image (C,E); and relative to the % of measured area (D,F). In both absolute (C,E) and relative (D,F), values, MAP2 and CLT expressions are higher in control cultures than in tbl ones. The asterisks indicate significant differences in the Student’s t test: ***p = 0.0008 (C); **p = 0.005 (D); ***p = 0.0005 (E); and ***p = 4.4E−06 (F). Bars = 50 µm. a.u., arbitrary units.

