Figure 5.
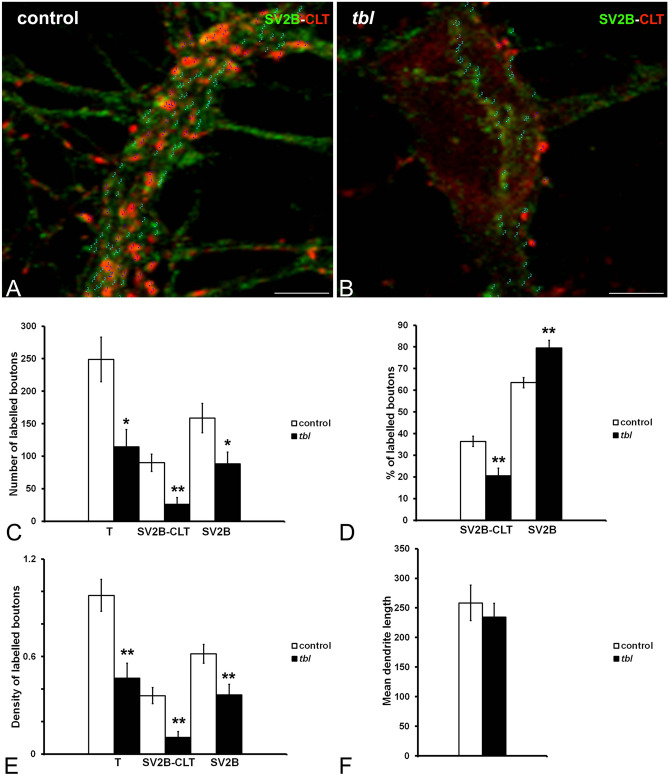
ImageJ composites illustrative of the count of presynaptic boutons expressing SV2B (green), CLT (red), or both immunoreactivities in control (A) and tbl (B) hippocampal cultures. (C–E), graphs showing the number of single SV2B and double (SV2B-CLT) labelled boutons (C), the percentage of labelled boutons (D), and their density of counted boutons per dendrite µm (E). The number of presynaptic boutons is higher in control relative to tbl cultures (C, T: *p = 0.014; SV2B-CLT: **p = 0.005; SV2: *p = 0.04). Correlative to these counts, the percentage of double labelled boutons is lower in tbl cultures relative to control ones (D, SV2B-CLT: **p = 0.007). The density of the number of all categories of presynaptic boutons counted is ever lower in tbl cultures than in control ones (E, T: **p = 0.005; SV2B-CLT: **p = 0.003; SV2: **p = 0.009), while no significant differences were found on the mean of the dendrite’s length measured (F; p = 0.544). Bars = 5 µm. T, total number of counted boutons.

