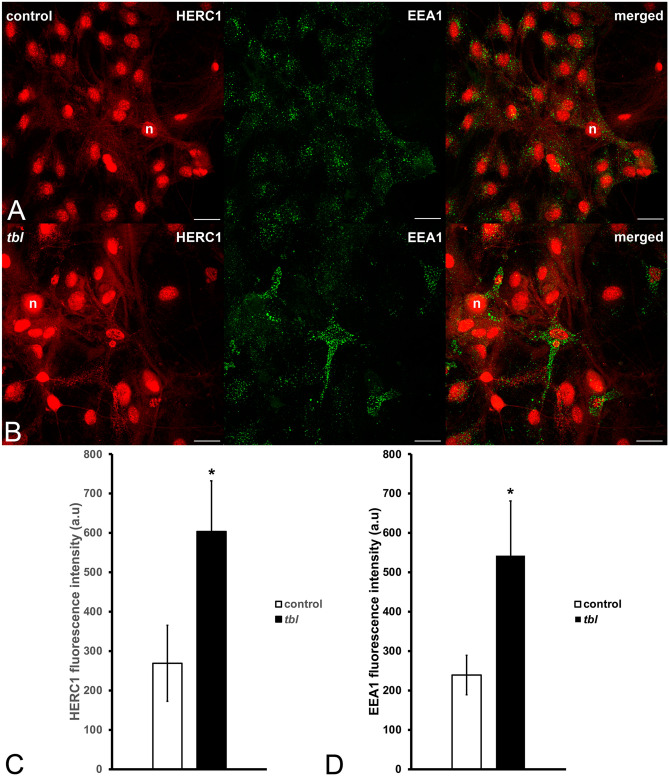
Figure 7.
ImageJ composites illustrative of the expression of HERC1 (red) and EEA1 (green), in control (A) and tbl (B) hippocampal cultures. (C–E), graphs show the intensity of the expression of HERC1 (C) and EEA1 (D). HERC1immunoreactivity is higher in tbl relative to control cultures (C, *p = 0.0404). Likewise, EEA1 expression is lower in control cultures relative to tbl ones (D, *p = 0.04276). Bars = 5 µm. n, neuronal cell nucleus.

