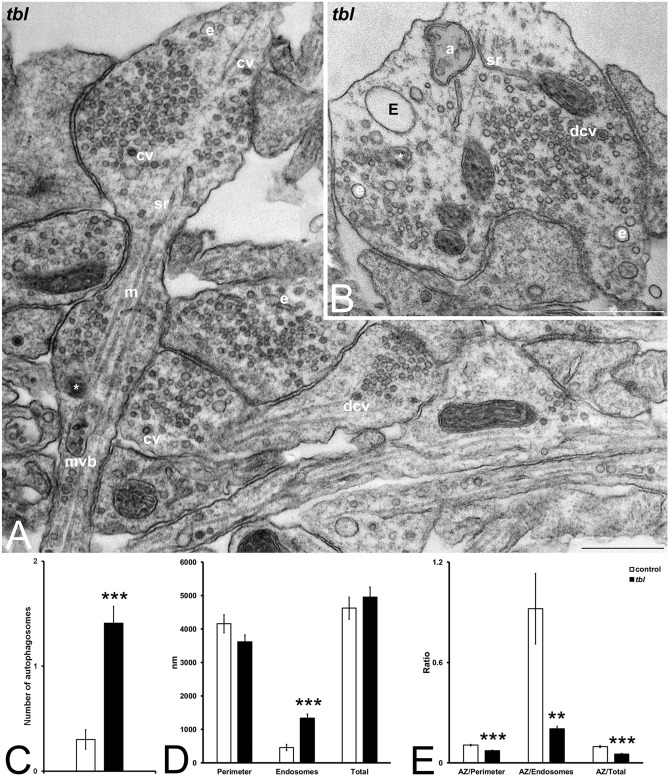
Figure 9.
Electron microphotographs of tbl synapses (A–B) in which great endosomes (E) and autophagy vacuoles (a) are easily distinguished. Autophagosomes are most numerous in tbl than in control presynaptic terminals (C, ***p = 8.09153E−05). No differences stand out in the perimeter length of the presynaptic boutons (D, Perimeter; p = 0.06094) as well as in the perimeter of all membranes measured (D, Total; p = 0.22775) between control and tbl presynaptic boutons; however, the perimeter of the membrane of endosomes and autophagosomes (D, Endosomes) is significantly greater in tbl than in control presynaptic terminals (***p = 5.7819E−07). The ratios between the active zone and the perimeter length (E, AZ/Perimeter), the values of endodomes and autophagosomes membrane length (E, AZ/Endosomes), and the total length of measured membranes (E, AZ/Total) are consistently greater in control presynaptic terminals than in tbl ones (***p = 2,769E−06; **p = 0.0017; and, ***p = 1.8152E−09, respectively). cv, coated vesicles. dcv, dense core vesicles. e, endosomes. m, microtubules; mvb, multivesicular body. sr, smooth endoplasmic reticulum. Bars = 500 nm.

