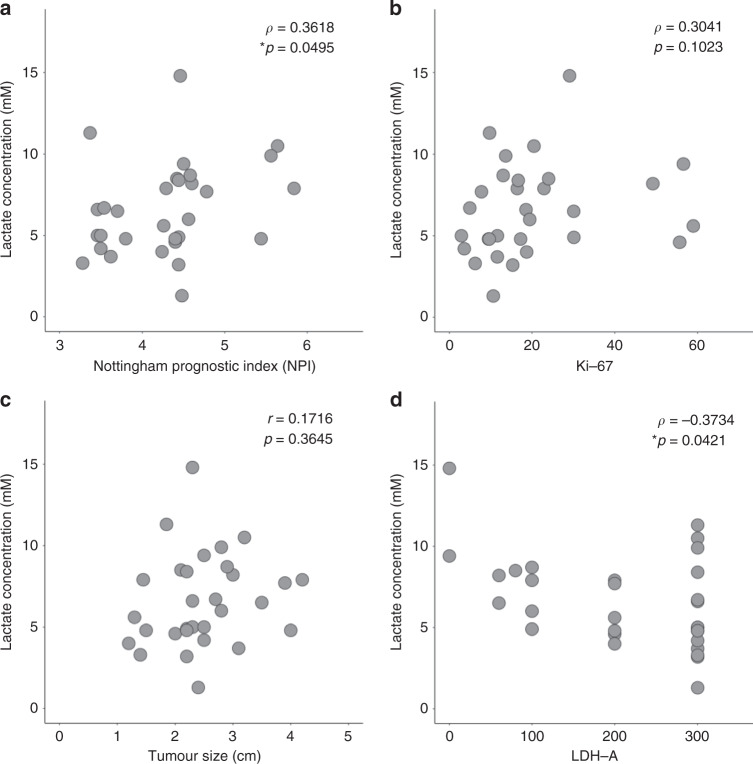
Fig. 3. Association between lactate concentration and NPI, Ki-67, tumour size and LDH-A.
Lactate concentration was correlated against a Nottingham Prognostic Index (NPI) (n = 30), b Ki-67 expression (n = 30), c tumour size (n = 30) and d lactate dehydrogenase A (LDH-A) expression (n = 30) within the entire cohort and shown as scatter plots. Spearman’s correlation tests (ρ score: a, b, d), Pearson’s correlation test (r score: c) were used and corresponding p-values are displayed. Statistically significant p-values (<0.05) are marked by ‘asterisk’.

