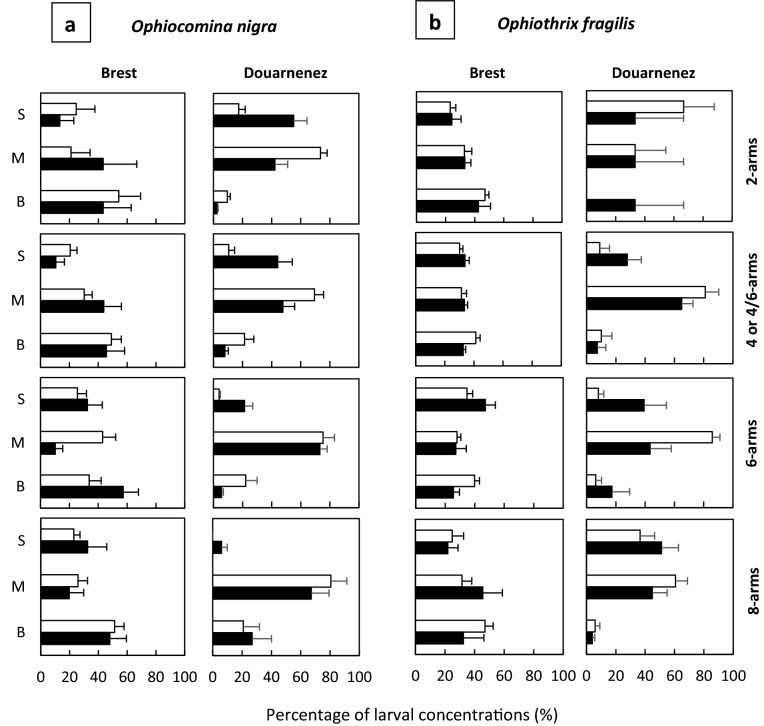
Figure 5.
Mean percentage of larval concentration at the three depths (S, surface; M, mid-depth; B, bottom) for Ophiocomina nigra (a) and Ophiothrix fragilis (b), during daytime (white bars) and nighttime (black bars), in the bay of Brest and the bay of Douarnenez. Fractions of total counts were computed separately for each larval stage, and averaged for each depth interval across daytime and nighttime samples. Error bars are standard errors.

