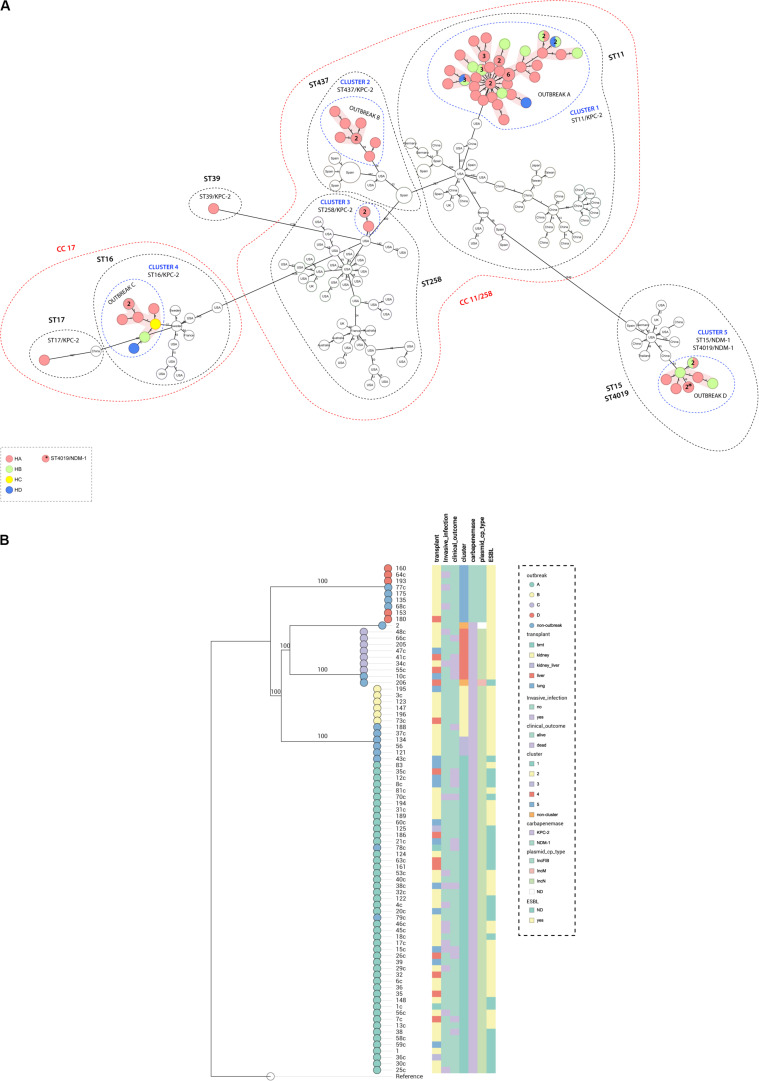
FIGURE 1.
(A) Minimum spanning tree. Distance based on an ad hoc cgMLST of 2567 genes. Each colored circle indicates the hospital origin of the isolates; more than one isolate is indicated with its respective quantities in numbers, and non-colored circles are isolates from other countries. Red shadow indicates outbreak, blue dashed circles indicate cluster, black dashed circles represent sequence types, and red dashed circles represent clonal complex. Distances are not in scale. (B) Maximum likelihood tree showing the relationship between isolates, branch lengths are indicative of the number of SNPs. Colored strips in (from left to right) transplant type, invasive infection, clinical outcome, cluster, carbapenemase type, plasmid type carrying the blaKPC–2 or blaNDM–1 genes, and ESBL type. Nodes are colored according to the outbreak caused by the isolates. Reference: K. pneumoniae NTUH-K2044 (accession no. NC_012731.1).

