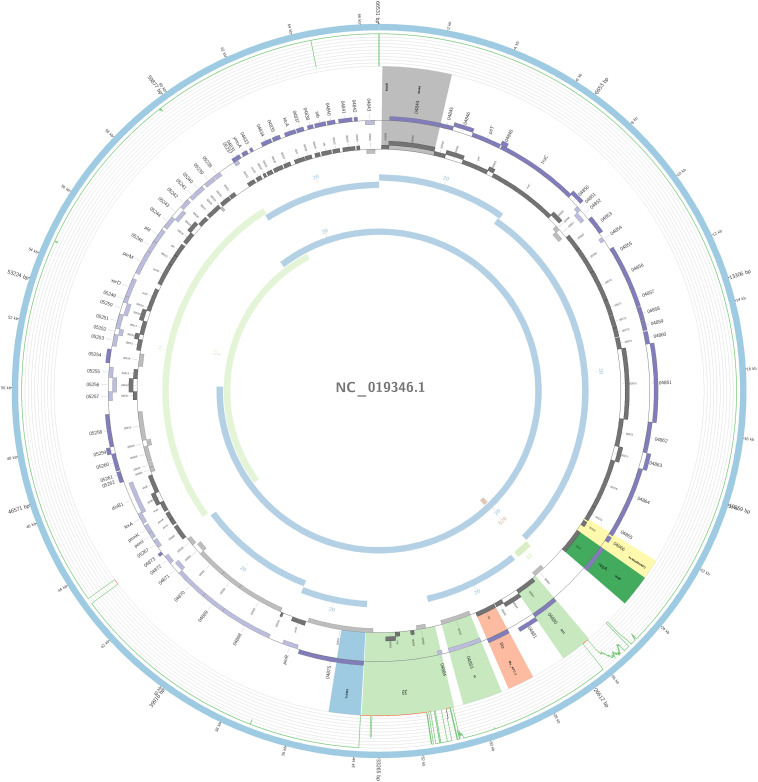
FIGURE 6.
Overview of the IncM plasmid harboring blaKPC–2 detected in K. pneumoniae ST17 non-outbreak involved in this study. The figure represents the blaKPC plasmid according to the homology with highly similar one from database (blue outer ring). Graph represents the Illumina reads mapped against this plasmid with depth of coverage ranging from 0 (red) to 500, colored orange when values are 1 to 20, and green if more than 200 reads. Gray boxes represent cds from automatic annotation, with dark and light color when they were found in forward or reverse strand, respectively. Colored stripes represent a more detailed annotation that includes antibiotic resistance genes in red, IS in blue, and Rep genes in yellow. Homology between constructed plasmid and Illumina assembled contigs is represented in the inner ring, with each contig colored according to its number.

