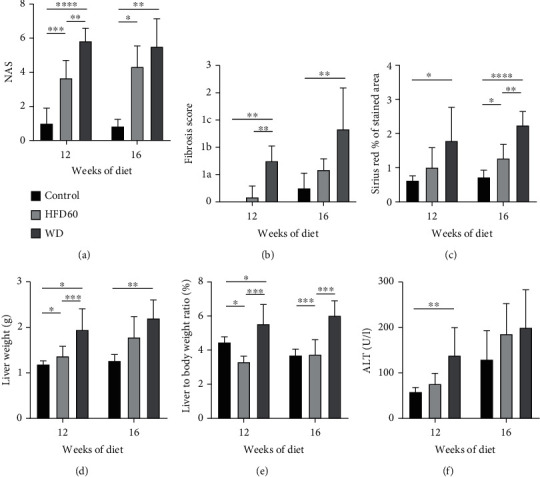
Figure 2.

Liver inflammation and fibrosis. (a) NAS scores for 12 weeks and 16 weeks; NAS was significantly higher in the WD and HFD60 groups than in the control group after 12 and 16 weeks and was higher in WD mice than in HFD60 mice after 12 weeks. Notably, NAS ≥ 5 in each individual animal after 12 weeks of WD. (b) The fibrosis score was increased in WD animals compared to that of control and HFD60 at both timepoints. (c) Sirius red staining displayed a significantly higher proportion of connective tissue fibers in WD livers than in control livers at the 12-week and than in control and HFD60 livers at the 16-week timepoint. At the 16-week timepoint, HFD60 showed significantly more connective tissue fibers compared to the control group. (d) Liver weight and (e) liver-to-body weight ratio were significantly increased in WD mice compared with those of mice in the other groups after 12 and 16 weeks of diet. (f) Significantly increased ALT levels in WD mice showed enhanced liver injury in WD mice after 12 weeks of diet.
