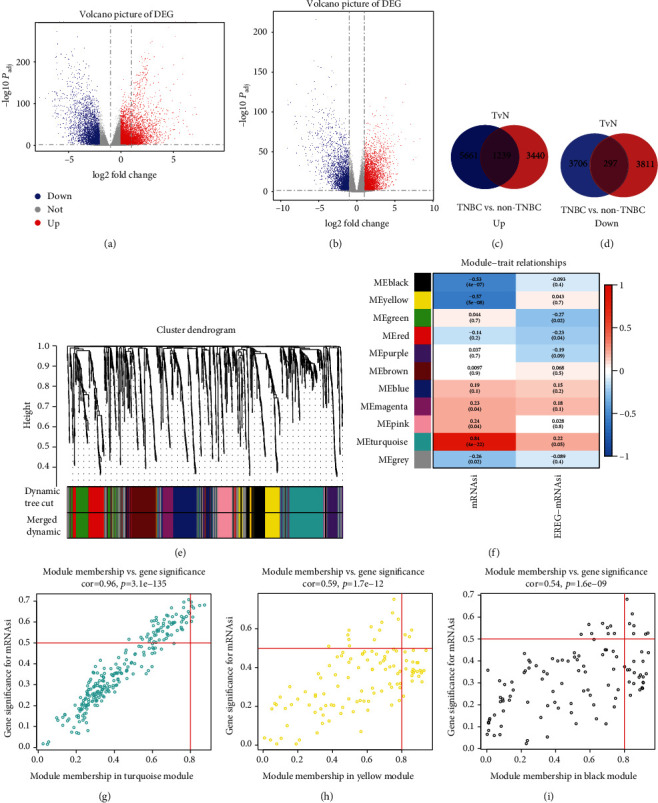
Figure 2.

Screening of key genes related to the stemness of TNBC. (a, b) Volcano plots of normal vs. tumor group (a) or TNBC vs. other subtypes of BC group (b). (c, d) Venn diagram of the overlap between two upregulated (c) and downregulated (d) gene datasets. (e) TOM cluster dendrogram of WGCNA: a branch of the tree corresponds a cluster of highly related gene sets. Dynamic Tree Cut represents the original module, while Merged Dynamic means the final module. No merging is needed, so they are the same. (f) Correlation of clinical traits (mRNAsi or EREG-mRNAsi) with modules. A color represents a class of genes, and the correlation coefficient and statistical power (p value) have been marked. (g–i) Gene modules with strong correlation with mRNAsi: turquoise module (g), yellow module (h), and black module (i). A dot represents a gene, and the upper right points are the gene that meets the screening criteria.
