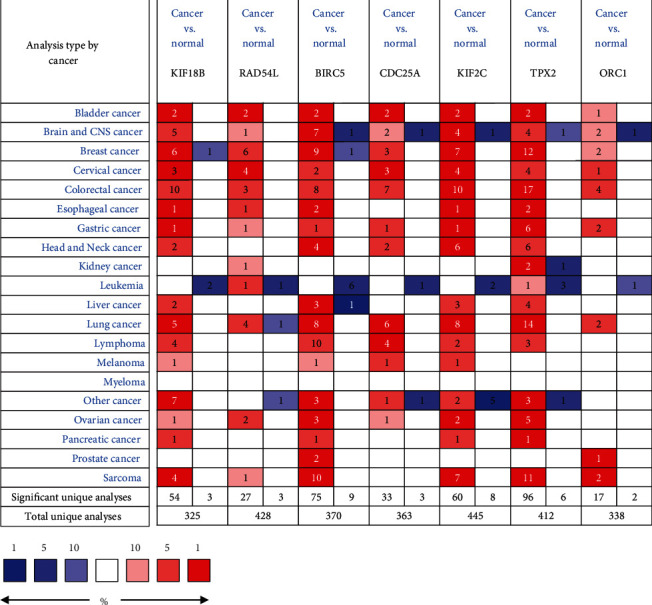
Figure 5.

Differential expression and prognosis of 7 key genes. The Oncomine database was used to analyze the differential expression between tumor and normal tissues in various cancers, red indicates the corresponding gene overexpressed while blue represents the low expression. Cells that do not reach the threshold will not show color.
