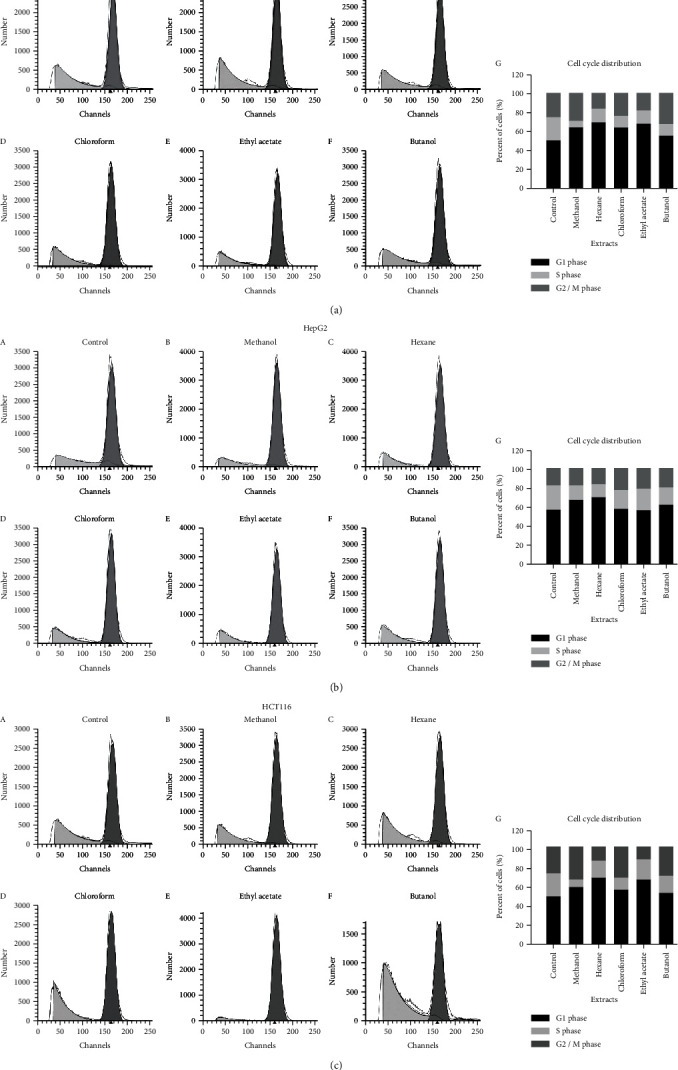
Figure 2.

Cell cycle analysis of cancer cell lines after Saussurea costus extract treatment. The cell cycle distribution of cells of the cell lines (a) MCF-7, (b) HepG2, and (c) HCT116 analyzed by DNA flow cytometry after their treatment with a plant extract. Bar graphs show the percentage of cells of a cancer cell line in different phases of the cell cycle after its treatment with a plant extract.
