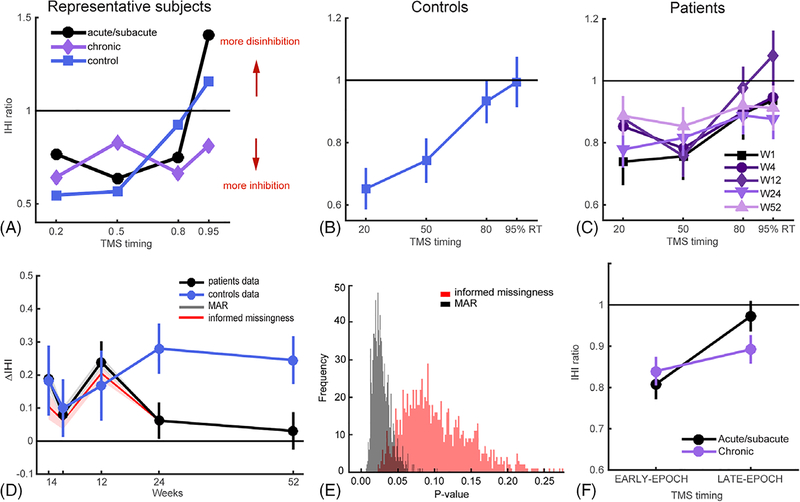
FIGURE 3:
Release of IHI before movement onset. (A) IHI curves for a representative patient and a healthy control. These exemplar IHI profiles illustrate the normal release of IHI in patients at the acute/subacute stage, comparable to control subjects, and the lack of normal release of IHI during the chronic period. (B) Overall mean IHI curves for healthy controls. Because there were no differences over time in premovement IHI in controls (mixed-effects model with Week and TMS-Timing as fixed factors showed no significant effect of Week, χ2 = 0.067, p = 0.80, but significant main effect of TMS-Timing, χ2 = 22.28, p < 0.001), we averaged control data across weeks. (C) IHI curves for each time point over the 1-year period for patients. (D) Evolution of ΔIHI for patients and controls over the 1-year period. Patients showed close to control level of ΔIHI in the acute/subacute periods (W1–12), but their ΔIHIs became abnormal at the chronic stage. Shaded plots in gray and red are sensitivity analysis with two imputation schemes with MAR and informed-missingness cases, respectively, where missing not at random (MNAR) cases are imputed with 1,000 samples from N~(μ(t,patient), σ(t,patient)) or N~(0, σpatient). (μ(t,patient) and σ(t,patient)) are estimated from patients data at each time point and σpatient is estimated from all patients’ data. (E) Distribution of p values from sensitivity analysis with multiple imputation for the MAR and informed-missingness cases. (F) Change of IHI level at different movement preparation epochs in patients from the acute/subacute to chronic stage after stroke. There was a significant interaction of IHIEARLY-EPOCH vs IHILATE-EPOCH or acute/subacute and chronic stages (χ2 = 4.34, p = 0.037), but no differences when comparing across acute/subacute vs chronic stages for IHIEARLY-EPOCH (t(14) = 0.75; p = 0.47) or IHILATE-EPOCH (t(14) = 1.69; p = 0.11). Means and variances in all plots were estimated by mixed models. IHI = interhemispheric inhibition; TMS = transcranial magnetic stimulation.

