Figure 6.
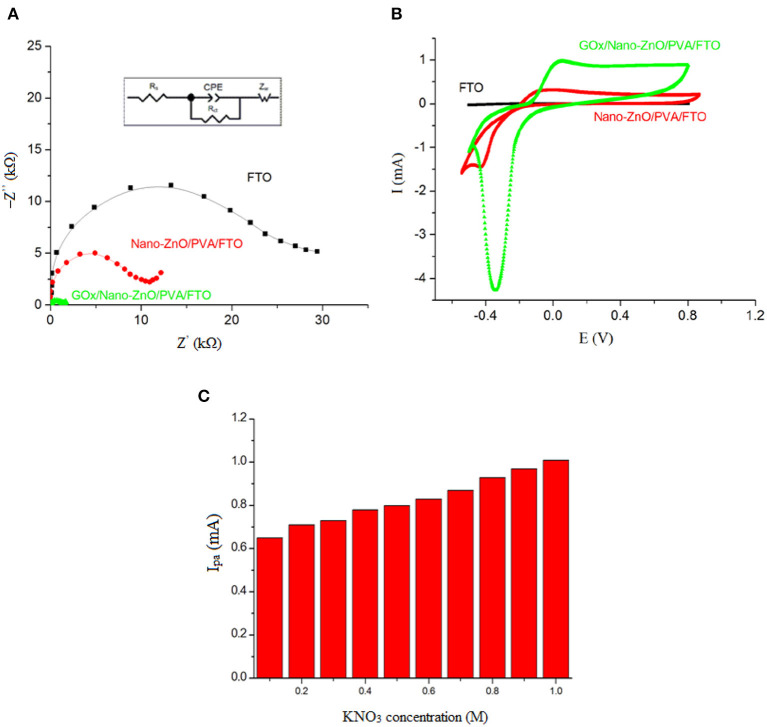
(A) The Nyquist plots (−Z″ vs. Z′), and (B) Cyclic voltammograms at the scan rate of 0.1 V s−1 obtained in PBS (pH 7.4) containing 5 mM glucose in the absence of [Fe(CN)6]3−/4− probe, and (C) The influence of KNO3 salt concentration, as a supporting electrolyte, on the cyclic voltammogram electrochemical response of 5 mM of glucose on GOx/Nano-ZnO/PVA/FTO biosensor. The inset in (A) shows equivalent circuit. (Zw: Warburg impedance, Ipa: anodic peak current, Rs: solution resistance, Rct: charge transfer resistance).

