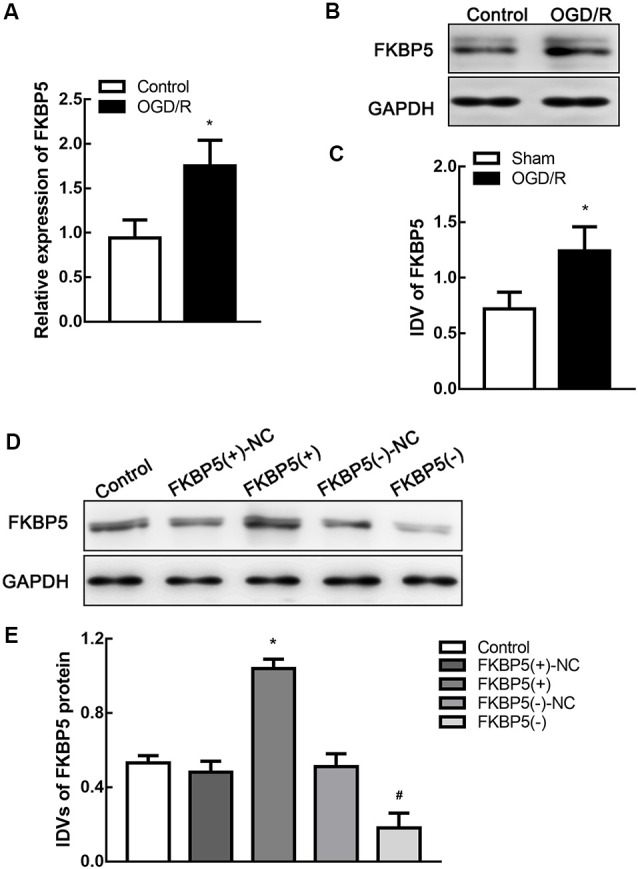
Figure 3.

FKBP5 was upregulated in oxygen and glucose deprivation and reoxygenation (OGD/R) cells and establishments of stable transfected cell lines. (A) Expression of FKBP5 in OGD/R and control group quantified by real-time qPCR. (B,C) Expression of FKBP5 in OGD/R and control group determined by Western blot assay. *P < 0.05 vs. control group. (D,E) Protein levels of FKBP5 after stably transfecting plasmids with FKBP5(+), FKBP5(−), and their relative noncoding (NC) sequences. Data are presented as the mean ± SD. *P < 0.05 vs. FKBP5(+)-NC group. #P < 0.05 vs. FKBP5(−)-NC group. For (A–E), n = 3 in each group.
