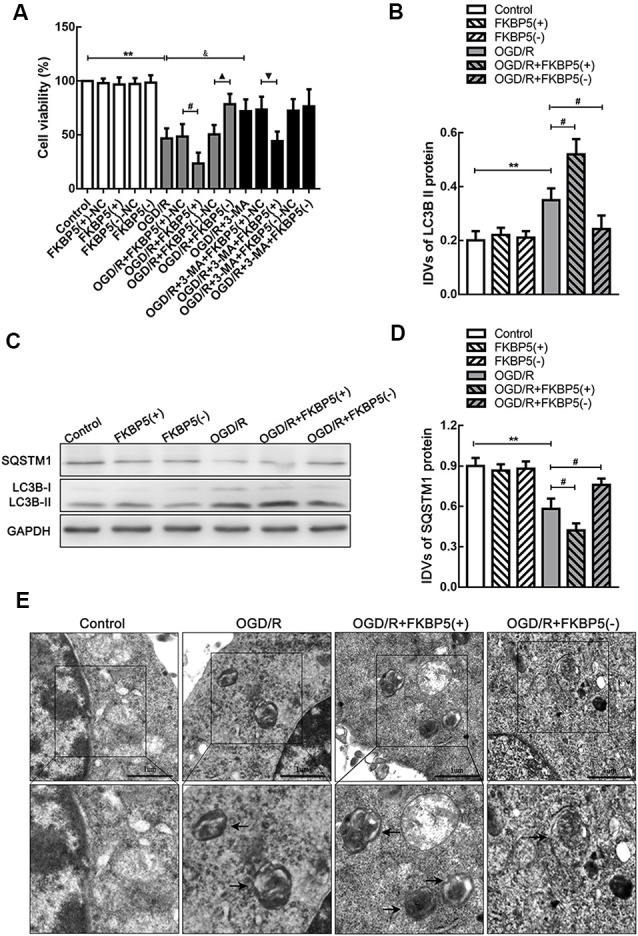
Figure 4.

FKBP5 aggravated cell damage via autophagy. (A) CCK-8 assay was performed to assess the influences of FKBP5 and autophagy on cell viability. **P < 0.01 vs. control group. #P < 0.05 vs. OGD/R + FKBP5(+)-NC group. ▴P < 0.05 vs. OGD/R + FKBP5(−)-NC group. &P < 0.05 vs. OGD/R group. ▾P < 0.05 vs. OGD/R + 3-MA+FKBP5(+)-NC group. (B–D) Western blot analysis of SQSTM1 and LC3B II expression in FKBP5 stably transfected cell lines. GAPDH was regarded as an endogenous control. Data are presented as the mean ± SD. Statistical analysis was conducted with nonparametric Mann–Whitney test. **P < 0.01 vs. control group. #P < 0.05 vs. OGD/R group. (E) TEM was used to observe the autophagosomes in OGD/R cells with altered FKBP5 expression. Arrows point to autophagic vacuoles (AVs) with double membranes. Scale bars represent 1 μm. For (A–E), n = 3 in each group.
