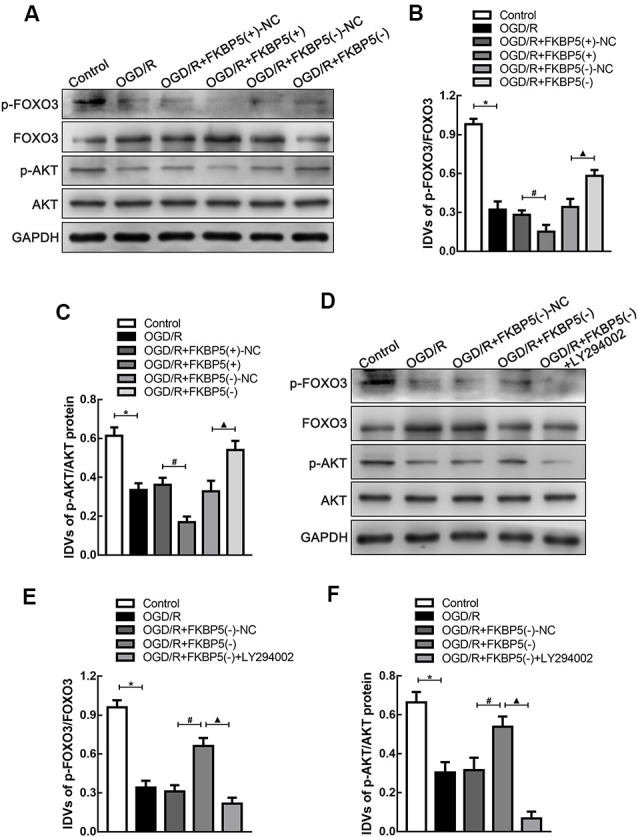
Figure 6.

FKBP5-regulated AKT/FOXO3 signaling pathway. (A–C) Protein levels of p-FOXO3/FOXO3 and p-AKT/AKT in the OGD/R group with altered FKBP5 expression. *P < 0.05 vs. control group. #P < 0.05 vs. OGD/R + FKBP5(+)-NC group. ▴P < 0.05 vs. OGD/R + FKBP5(−)-NC group. (D–F) Western blot analysis of p-FOXO3, FOXO3, p-AKT, and AKT expression in OGD/R cells with the treatment of FKBP5(−) and LY294002. GAPDH was regarded as an endogenous control. *P < 0.05 vs. control group. #P < 0.05 vs. OGD/R + FKBP5(−)-NC group. ▴P < 0.05 vs. OGD/R + FKBP5(−) group. For (A–F), n = 3 in each group.
