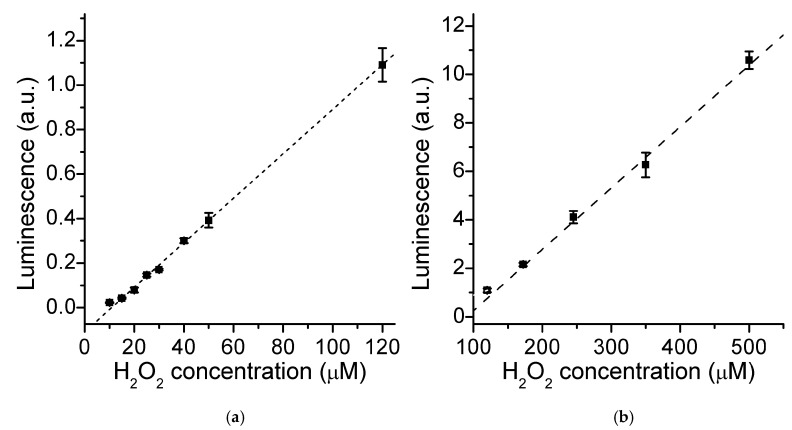
Figure 6.
(a) LS response to H2O2 concentration, as measured at 2 min after hydrogen peroxide addition in the 10.0–120 μM range. (0.3 μM FeMC6*a, 0.1 mM luminol, 100 mM Tris buffer pH 8.5) (b) LS observed at different H2O2 concentrations in the 120–500 μM range. Short- and long-dashed lines correspond to the best linear fits of the two datasets, respectively.

