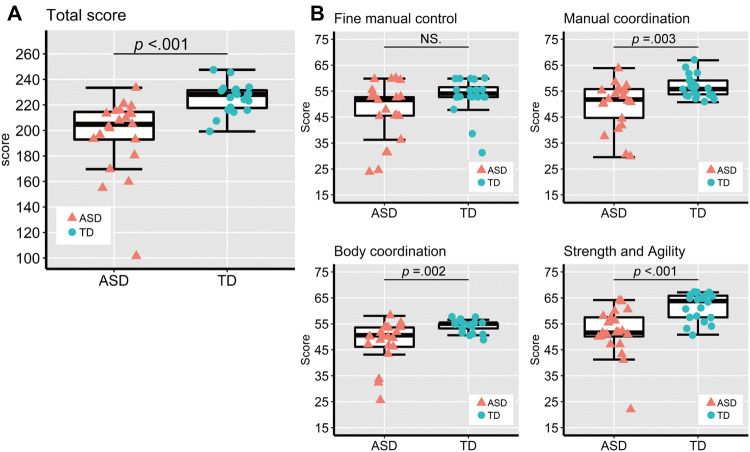
Fig. 3.
BOT-2 scores. a BOT-2 total score in the ASD and TD groups. The upper and lower boundaries of the standard boxplots represent the 25th and 75th percentiles. The horizontal line across the box marks the median of the distribution. The vertical lines below and above the box represent the minimum and maximum values, respectively. b BOT-2 scores in the four subcategories in the ASD and TD groups. Bonferroni correction for multiple comparisons was applied to the Student’s t-test analysis (adjusted alpha p < 0.0125)

