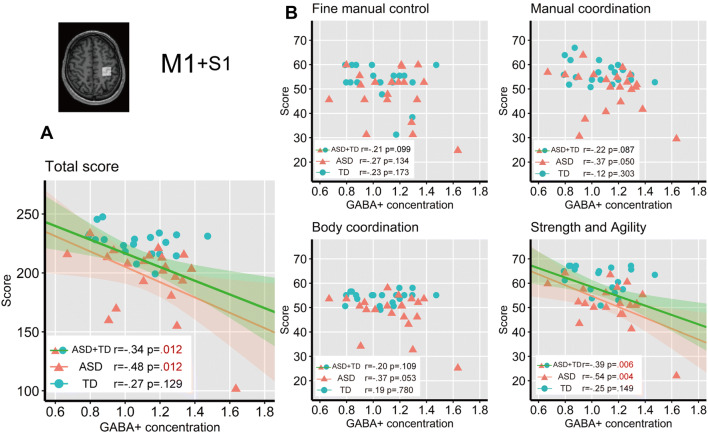
Fig. 6.
Correlations between tissue-corrected GABA+ concentrations in M1 and BOT-2 scores. The shaded areas (green and pink for ASD + TD and ASD, respectively) denote 95% of the confidence interval for the correlation. a Correlation between M1 GABA+ concentration and total BOT-2 score. b Correlation between GABA+ concentration in M1 and subcategory BOT-2 scores. Bonferroni correction for multiple comparisons was applied to the correlation analysis (adjusted alpha p < 0.0125)

