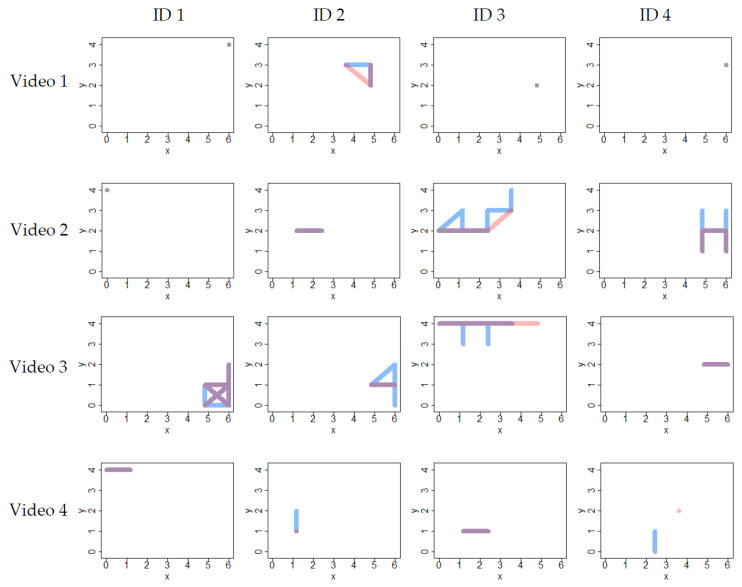
Figure 6.
Trajectories walked by individual birds in the four videos. Each square represents the pen from above. The four videos (see Table 2) are on separate rows, while different columns represent different individuals in these videos. The blue line represents the video track, while the pink line represents the RFID track. Overlapping parts of the track are depicted in purple.

