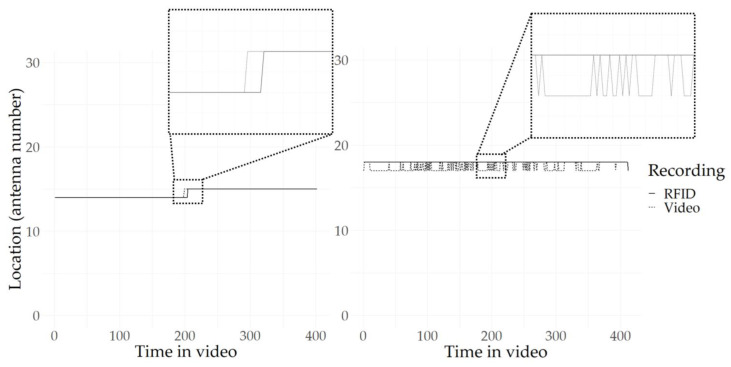
Figure 7.
Locations over time for two individuals in two videos. The solid black line represents the RFID location, while the dashed black line represents the video location. In the boxes, zoomed-in parts of the graph are shown. (a) Almost fully matching track from animal ID 2 from video 2; (b) track with many mismatches occurring from animal ID 4 from video 3.

