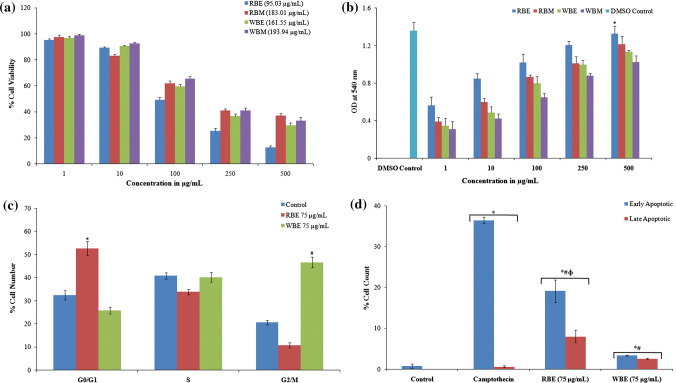
Fig. 3.
Analysis of cytotoxicity and anticancer action of extracts against HT-29 cancer cells. a MTT assay showing cytotoxicity of RBE and WBE against HT29 cells (IC50 values are shown in brackets); b LDH release assay showing extracts effect on cell membrane integrity [*RBE-500 μg/mL significantly different from other extracts]; c cell cycle arrest. Histogram illustrating the cells (%) arrested in various stages of the cell division cycle as obtained from flow cytometry analysis. Treatment–untreated control, camptothecin (50 μM), RBE (75 μg/mL) and WBE (75 μg/mL) (*#significance of difference of RBE and WBE with the untreated sample respectively); and d graphical representation showing cells in early and late phase apoptosis (*significance of difference from untreated, #significance of difference from positive control and Φsignificance of difference between RBE and WBE)

