
Figure 4. Heterochronic specification of ventral and dorsal coronary lymphatics.
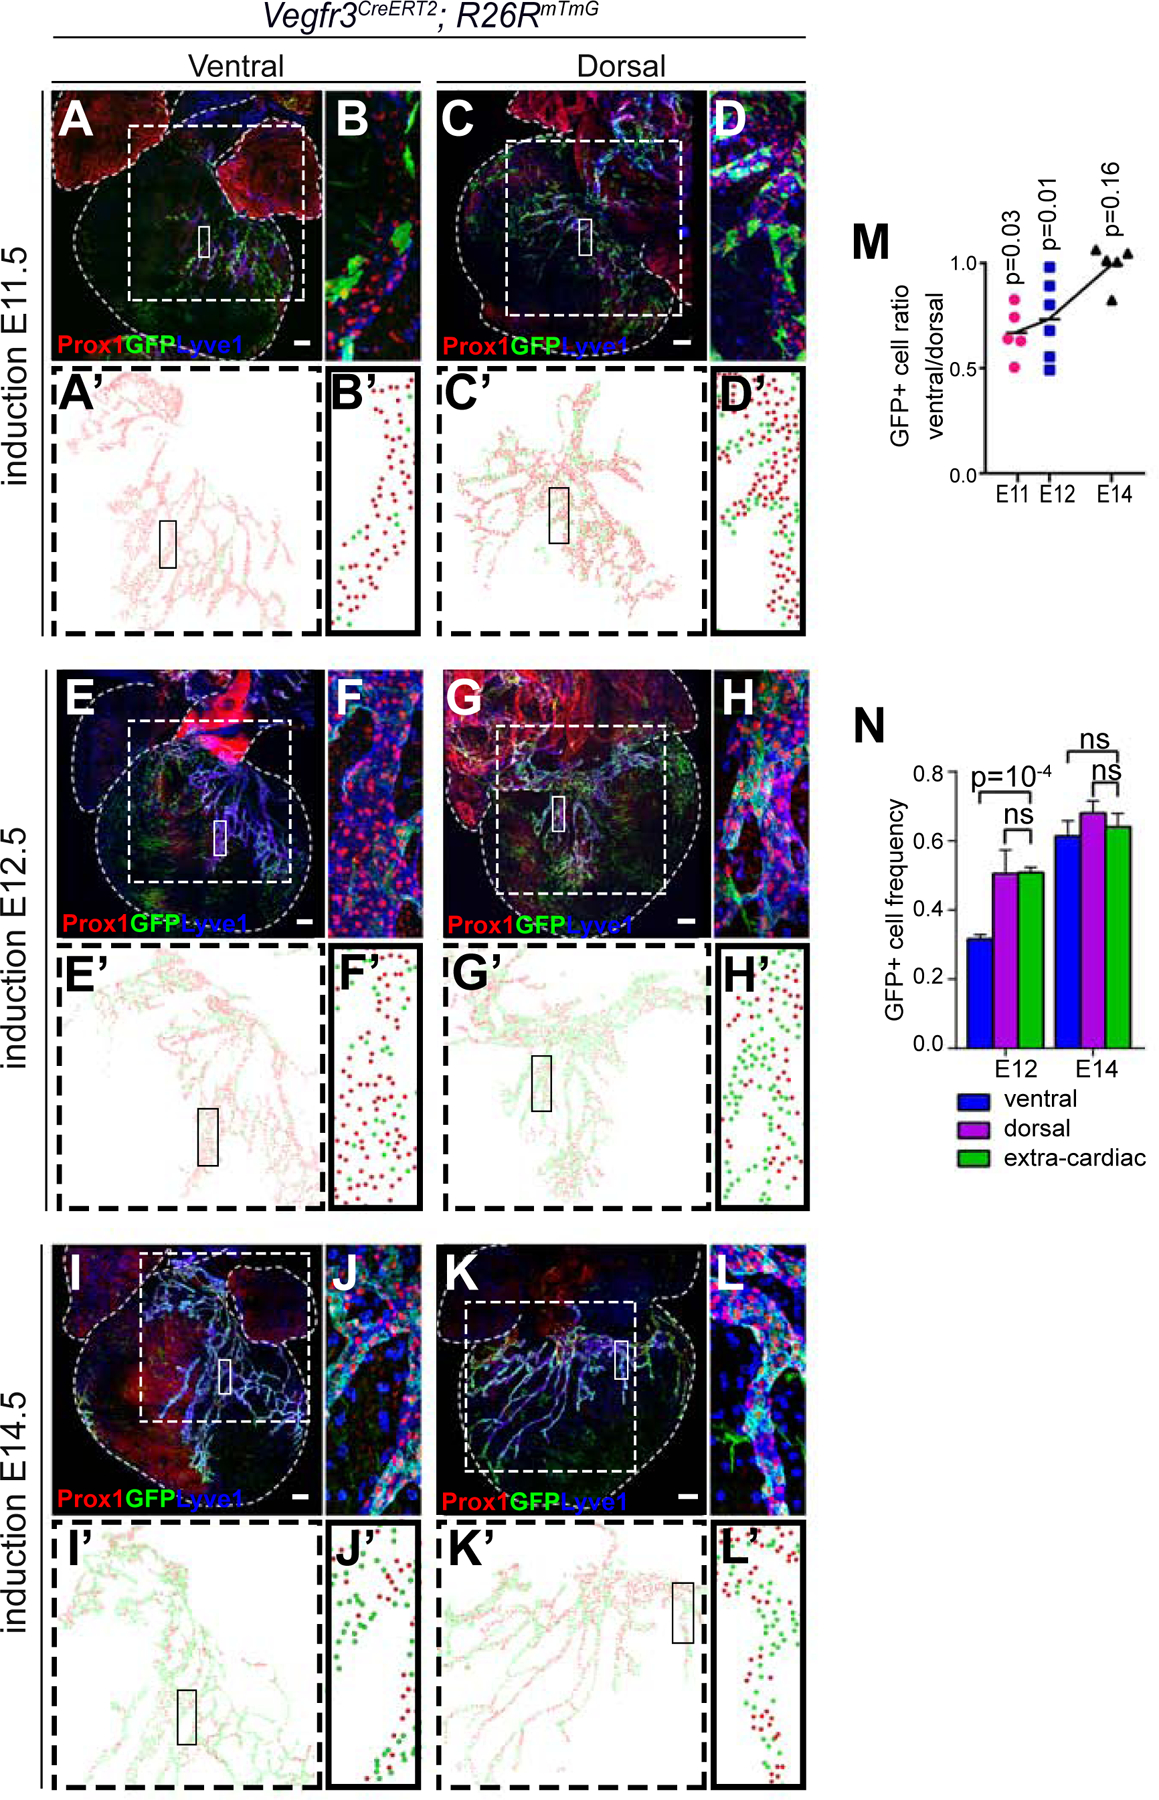
(A–L) Z-projections of confocal stacks showing the lymphatic vasculature and the lineage of Vegfr3-expressing cells at E17.5 following induction of recombination at E11 (A–D), E12 (E–H) and E14 (I–L). (B, D, F, H, J and L) show magnifications of the boxed areas in (A, C, E, G, I and K), respectively. (A, E and I) show ventral lymphatics and (C, G and K) show dorsal lymphatics. (A’-L’) show examples of the scoring of Vegfr3 lineage-positive (GFP+) and lineage-negative (GFP−) LECs. Green dots indicate positive LECs and red dots indicate negative LECs. (M) Graph showing the ratio of GFP+ LEC frequency between ventral and dorsal LECs following induction of recombination at different stages. p-values in each stage of induction show the significance of the difference in the proportion of positive cells between dorsal and ventral sides of each heart by paired T-test. (N) Graph showing the frequencies of GFP+ LECs in ventral, dorsal and extracardiac lymphatics following inductions at E12 and E14. N=4 hearts/stage in both M and N. Paired T-test was used for calculating the p values. Ns, p-value> 0.05. Error bars show standard error of the mean (SEM). All scale bars: 100µm.