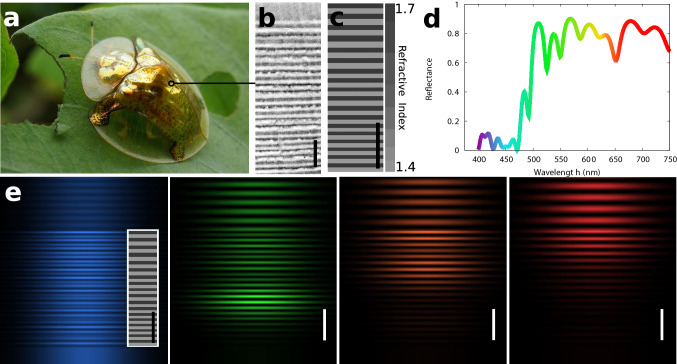
Figure 2.
Retrieving chirped dielectric mirrors. (a) Aspidomorpha tecta, “Fool’s gold beetle”, photograph by Indri Basuki. (b) TEM image of the structure on the cuticule, taken from32. (c) Result of the optimization by evolutionary algorithms with a larger period at the top than at the bottom. (d) Reflection spectrum of the structure. (e) Electric field distribution map upon normal-incidence illumination, obtained using Moosh25, showing how different wavelength (and thus colors) are reflected (or not) at different depth in the chirped dielectric mirror. From left to right: blue (400 nm), green (530 nm), orange (600 nm) and red (700 nm). In the blue region of the spectrum (left), light can be seen crossing the whole structure without any damping and propagating again in the substrate. Scale bars: 1 μm.

