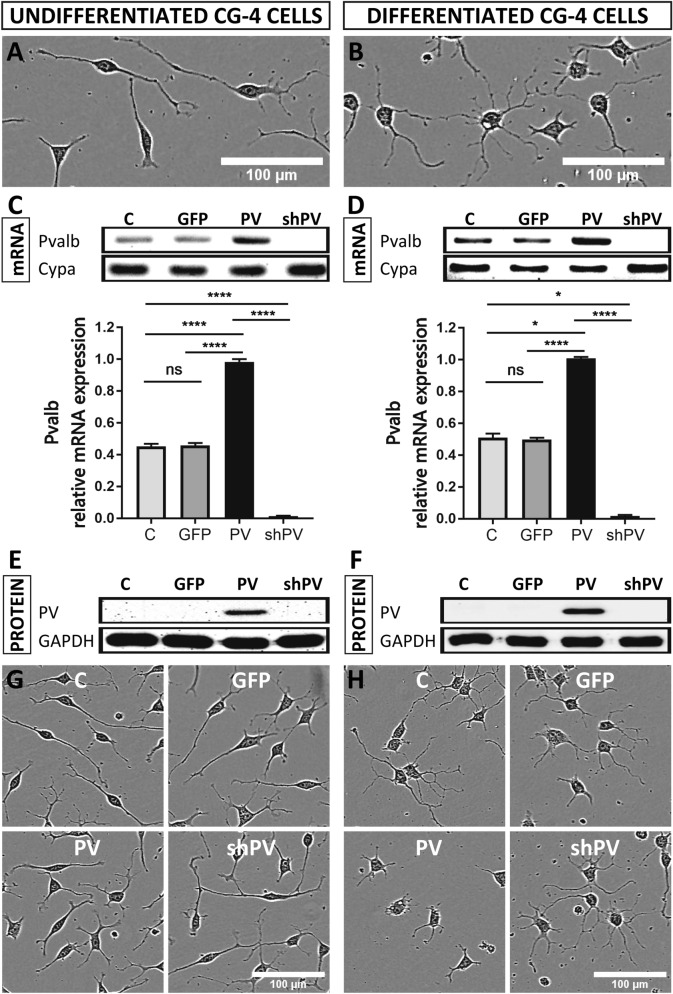
Figure 1.
CG4 cells display an OPCs-like morphology in the undifferentiated state (A) and oligodendrocyte-like phenotype in the differentiated state (B). PV (Pvalb) transcript levels were determined by semi-quantitative PCR after 30 cycles (upper) and by RT-qPCR (lower), where Cypa was used as reference gene (C,D). PV expression levels were determined by Western blot analyses, where GAPDH signals were used as loading control (E,F). The morphological features of LV-infected CG4 cells (GFP, PV, shPV) appeared similar to the control (C) in both undifferentiated OPC-like and differentiated OLG-like states (G,H). Images A, B, G and H were acquired with the IncuCyte system. The same raw data (movie) files were also used to select representative cells shown in Figs. 6A, B and 7A, B. All movie files are available in the ZENODO repository https://doi.org/10.5281/zenodo.39072891. The individual frames from which the representative cells were taken are marked and annotated in the “Supporting Information” (.pdf) file available in the same repository.

