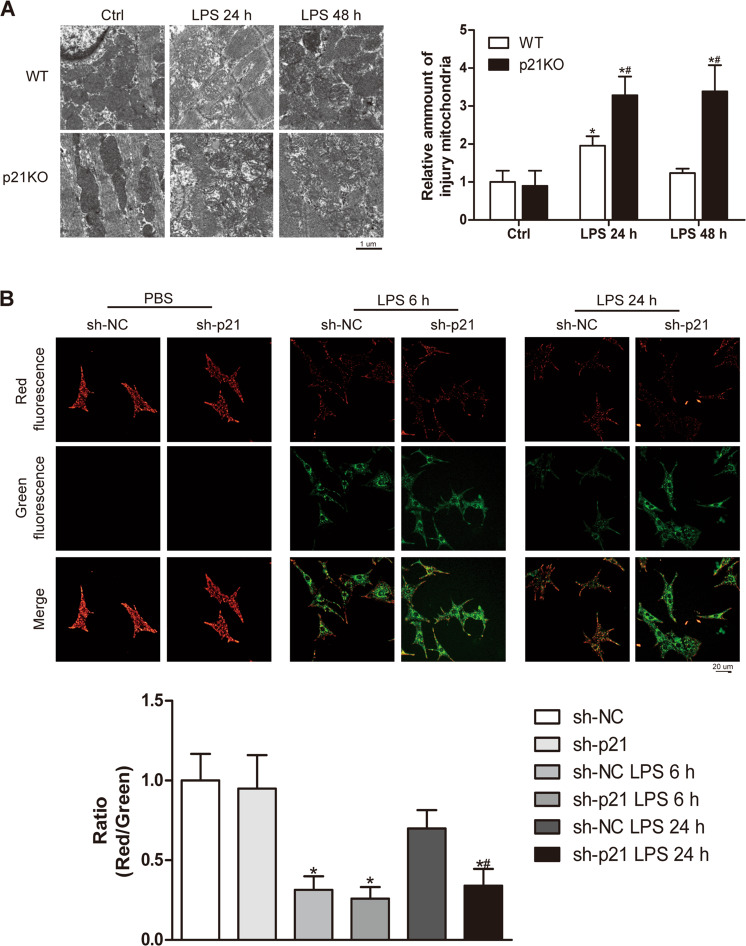
Fig. 4. p21 deficiency aggravated LPS-induced mitochondrial injury.
a Representative transmission electron microscopic images of mitochondria (left panel) and quantification of the injured mitochondria (right panel) in the indicated heart tissue groups (n = 6). b Representative images of JC1 staining (upper panel) and quantitative analysis of the shift of mitochondrial red fluorescence to green fluorescence (lower panel) in NRCMs (n = 6). *p < 0.05 versus Ctrl group, #p < 0.05 versus corresponding LPS group.

