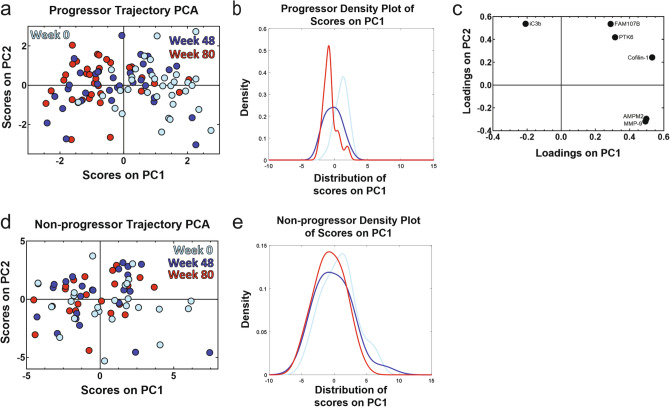
Figure 7.
Trajectory PCA highlights changes in blood protein expression over time in progressors that is not seen in non-progressors. (a) A trajectory PCA model based on three time points of progressor blood protein measurements highlights the change in protein expression patterns over time in IPF progressors. The week 0 scores on principal component 1 (PC1) were found to be significantly different from both the week 48 scores (p < 0.001) and the week 80 scores (p < 0.001) by one-way ANOVA with Tukey’s post hoc test. The week 48 and week 80 scores were not found to be significantly different from one another by the same test (p = 0.16). (b) The kernel density plot of the scores on PC1 provides another way of viewing the differences in the scores distribution of across all three time points of progressors. (c) The LASSO-identified signature separates the three time points of progressor measurements while capturing 49.95% of the natural variance in the data across the first two principal components. (d) A trajectory PCA model based on three time points of non-progressor protein measurements does not show clear separation across the three time points. None of the scores on PC1 of the three time points were significantly different from each other after one-way ANOVA with Tukey’s post hoc test (all p > 0.05). (e) The kernel density plot of the scores on PC1 highlights the overlapping of the scores on PC1 from the three time points of non-progressors.

