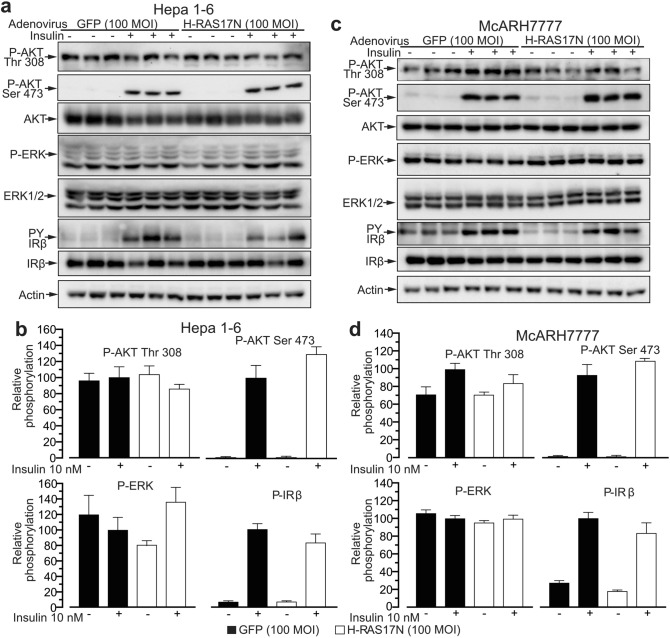
Figure 2.
Murine hepatoma cell line Hepa 1–6 and rat hepatoma cell line McARH7777 display aberrant insulin signaling. (a) Immunoblot analysis of insulin signaling in the Hepa 1–6 cells infected with 100 MOI of a control adenovirus expressing the GFP or a virus expressing the negative dominant RAS mutant H-RAS17N and stimulated with 10 nM insulin for 8 min. (b) Quantification of blots in (a). (c) Immunoblot analysis of insulin signaling and insulin receptor phosphorylation as in (a) was performed using the McARH7777 cell line. (d) Quantification of blots in (c). n = 3 independent experiments. Data are represented as mean ± SEM.

