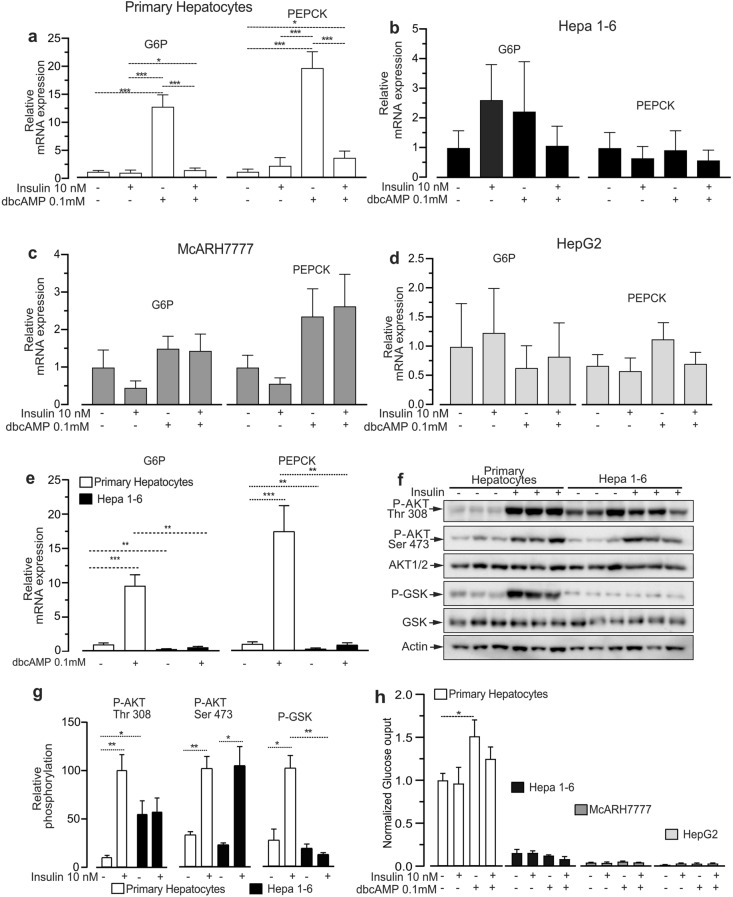
Figure 3.
Hepatoma cell lines display severely impaired gluconeogenic gene expression and blunted glucose production. (a) qPCR analysis of mRNA levels of glucose 6 phosphatase (G6P) and phosphoenolpyruvate carboxykinase (PEPCK) in primary mouse hepatocytes exposed for 6 h to 100 µM of dbcAMP, or 10 nM insulin, or 100 µM dbcAMP and 10 nM insulin. (b) qPCR analysis of mRNA levels of G6P and PEPCK in Hepa 1–6 cells treated as in (a). (c) qPCR analysis of mRNA levels of G6P and PEPCK in McARH7777 cell line treated as in (a). (s) qPCR analysis of mRNA levels of G6P and PEPCK in HepG2 cells treated as in (a). (e) Direct comparison of basal and cAMP-induced G6P and PEPCK mRNA levels in primary mouse hepatocytes and mouse Hepa 1–6. (f) Immunoblot analysis of insulin-driven AKT Thr 308 phosphorylation, AKT Ser 473 phosphorylation and GSK3β phosphorylation in primary hepatocytes and Hepa 1–6 cells stimulated for 8 min with 10 nM insulin. (g) Quantification of blots in (f). (h) Relative glucose production in primary hepatocytes, Hepa 1–6, McARH7777, and HepG2 stimulated with 100 µM dbcAMP in presence or not of 10 nM insulin for 6 h. n = 8 for (a); n = 5 for (b); n = 8 for (c); n = 7 for (d); and (e) n = 8 for heaptocytes and n = 5 for Hepa 1–6 n = 3 for (f, g) n = 3; for (h) n = 5 hepatocytes and n = 4 for each hepatoma cell line. n indicates biological replicates for primary hepatocytes, and independent experiments for cell lines. Data are represented as mean ± SEM.

