Figure 4.
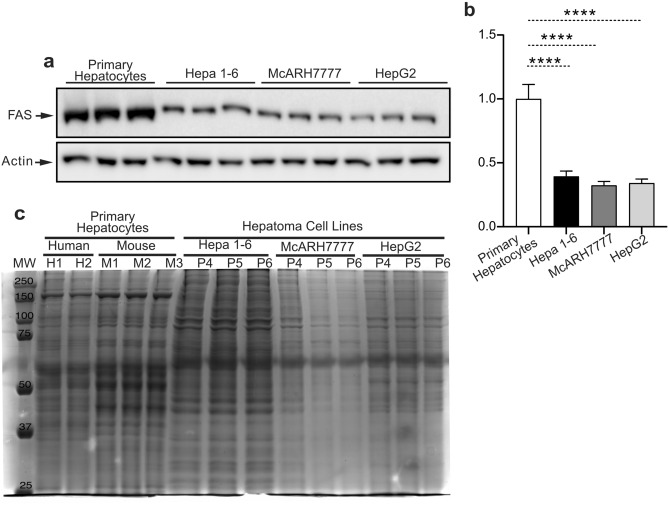
Hepatoma cell lines display reduced fatty acid synthase expression and a distinct protein electrophoresis pattern. (a) Immunoblot analysis of FAS on primary hepatocytes, Hepa 1–6, McARH7777, and HepG2. (b) Quantification of blots in (a). (c) Coomassie staining of a protein electrophoresis of extracts from human primary hepatocytes, murine primary hepatocytes, Hepa 1–6, McARH7777, and HepG2. n = 9 for a and b; n = 2–3 for c. n indicates biological replicates for primary hepatocytes, technical replicates for human hepatocytes, and independent experiments for cell lines. Data are represented as mean ± SEM.

