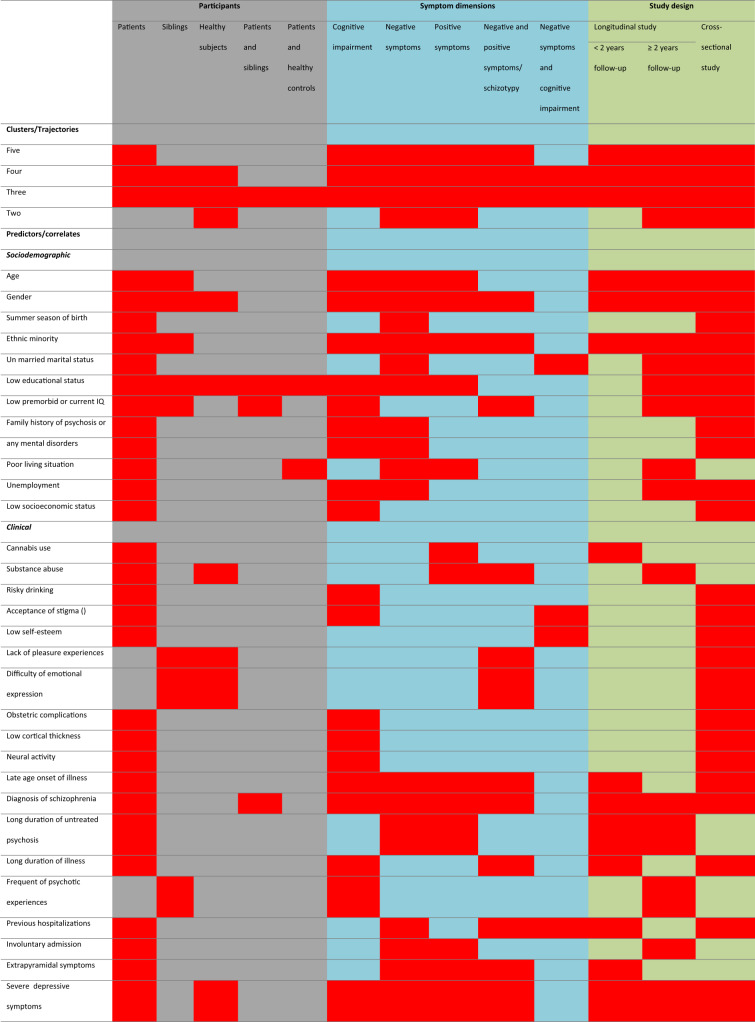
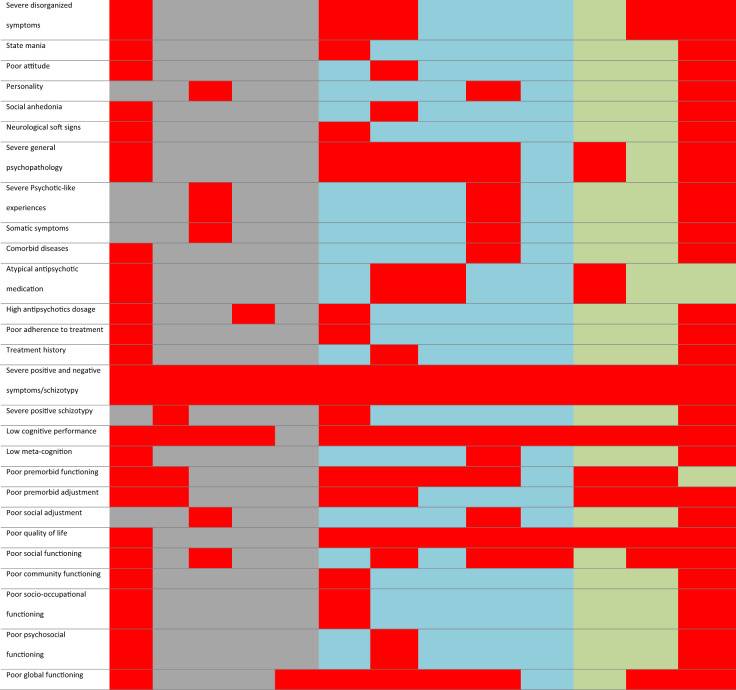
Table 3.
Heatmap summary of clusters/trajectories and predictors across study participants, symptom dimensions and study design.
This table/map can only be read and interpreted horizontally. For example, five clusters/trajectories were found in both longitudinal and cross-sectional studies among patients based on schizophrenia symptoms and cognitive deficits [all red boxes]. The same procedure applies to predictors. For example, age found to be the predictor of clusters/trajectories of schizophrenia symptoms and cognitive deficits in longitudinal and cross-sectional studies among patients and siblings [all red boxes].


