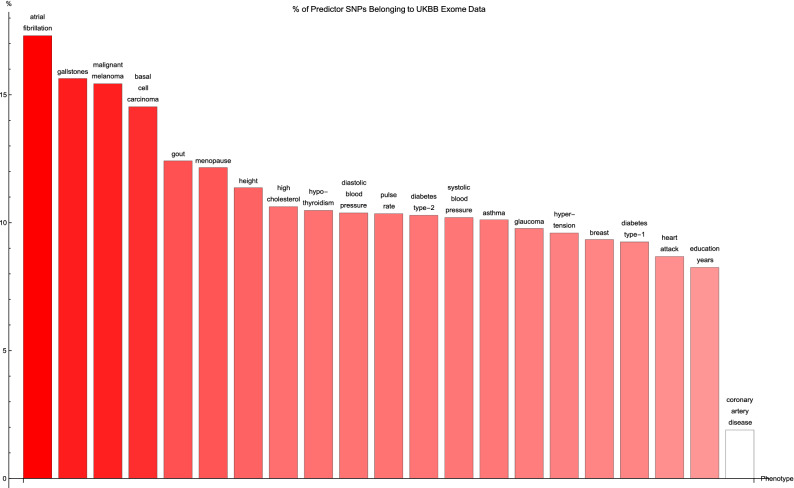
Figure 3.
The percentage of predictor SNPs which are found both in genic regions and the UK Biobank exome data, for each disease condition. The disease conditions are listed from left to right on the horizontal axis in order of decreasing percentage. Each vertical bar is colored red with a depth of shade proportional to the height of the bar. Here, “genic” SNPs are contained within the GENCODE Release 19 gene boundaries plus 30 kilo base pairs at both ends.

