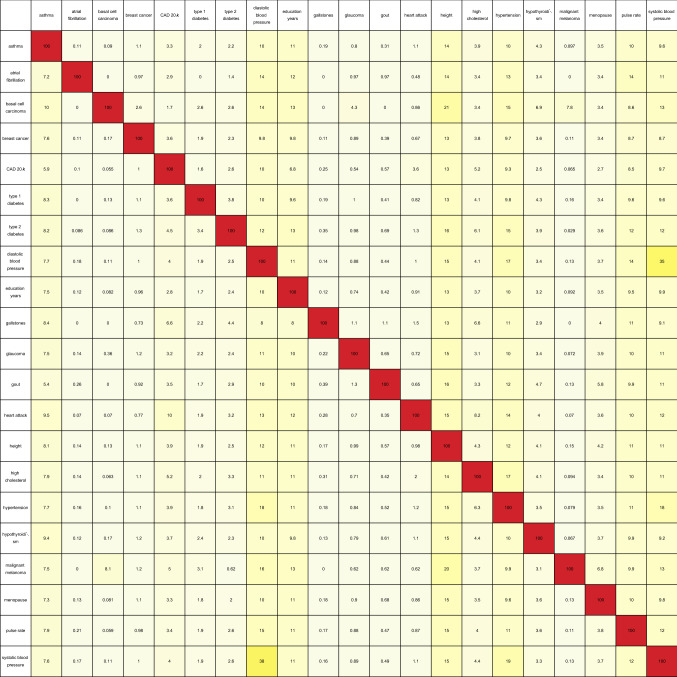
Table 1.
Table containing the pairwise overlap between predictors in terms of the number of predictor SNPs in common, expressed as a percentage of the total number of SNPs in the predictor for the condition labelling each row. Pairs of SNPs less than 4,000 base pairs apart were considered to be identified with one another. For a particular row, the number in each column represents the percentage of SNPs from the row predictor that can be identified with the SNPs from the column predictor.

