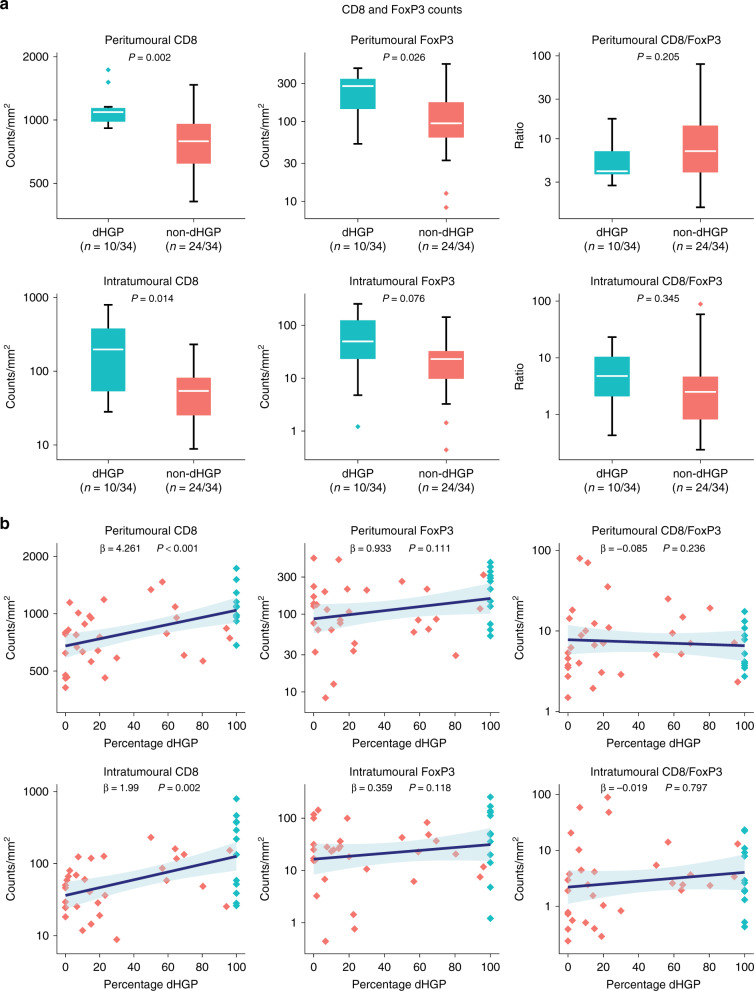
Fig. 4. Results of quantitative immunohistochemistry in cohort B.
a Box and whisker plots of intratumoural and peritumoural counts/mm2 stratified by histopathological growth pattern (HGP) and displayed on a logarithmic scale. The white line represents the median, the box represents the interquartile range (IQR), and the whisker represents the range. Outliers are defined according to the 1.5 rule (i.e. outside [Q1 − 1.5 × IQR; Q3 + 1.5 × IQR]). b Linear regression models of intratumoural and peritumoural counts/mm2 (y-axis, logarithmic scale) and the percentage of the desmoplastic-type histopathological growth pattern (dHGP) scored at the tumour–liver interface (x-axis). The blue line represents the regression coefficient; the light blue ribbon represents the corresponding 95% confidence interval. Measurements of individual patients are displayed using dots. Red dots represent patients with non-dHGP (i.e. <100% dHGP), and blue dots represent patients with dHGP (i.e. 100% dHGP).

