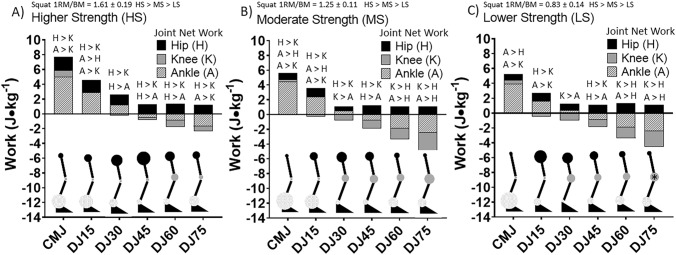
Figure 5.
Comparison of net work for the hip, knee and ankle between higher strength (HS), moderate strength (MS) and lower strength (LS) groups for the countermovement jump (CMJ) and drop jumps (DJ) from 15, 30, 45, 60 and 75 cm. Significances indicted at p ≤ 0.05. H > K, A > K, A > H, H > A, K > A, K > H significances indicted at p ≤ 0.05. *Indicates the knee net work was significantly great in LS in comparison to HS at p ≤ 0.05. The size of the circles at each joint are a scaled quantitative representation of the relative amount of net work performed by that respective joint.

