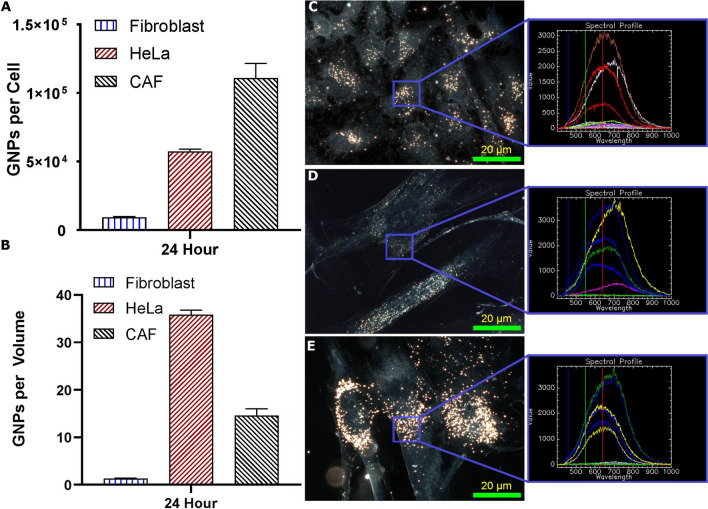
Figure 3.
Uptake and retention of gold nanoparticles. (A, B) Quantification of uptake of 0.2 nM GNPs into all three cell lines as measured using ICP-MS. Error bars are standard deviations from triplicate measurements. (A) is GNP per cell, while (B) is normalized to the average volume of each cell line. (C–E) Darkfield images of the GNPs encapsulated in the three cell lines with HeLa on top, FBs in the middle, and CAFs on the bottom. Overlay: the spectrum from HSI is matched in each sample to that of GNPs previously measured. Images taken after 24 h of GNP exposure. Experiments were repeated three times and the data presented is the average. The error bars represent standard deviation. Scale bar = 20 µm.

