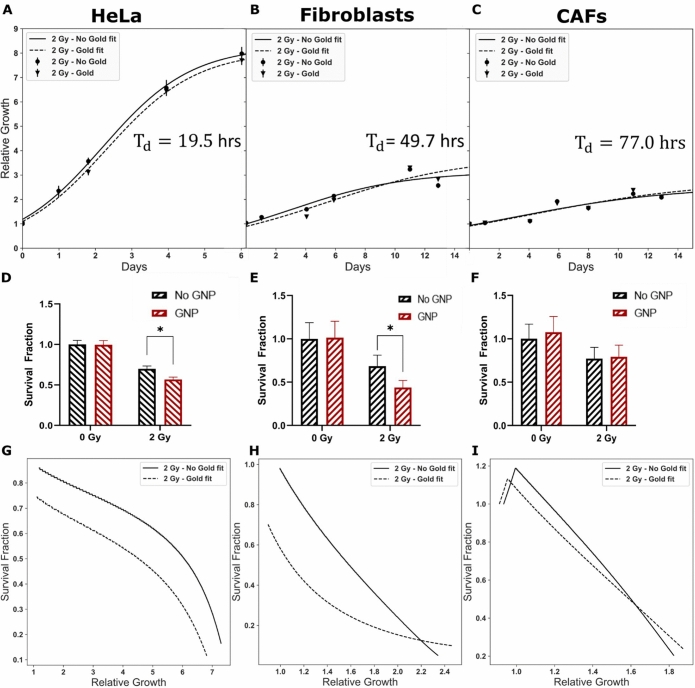
Figure 5.
Proliferation assay. (A–C) Reparametrized logistic curve fit (line) using non-linear least square to collected data (points). (D–F) Survival fraction estimated from delay in growth curve after one doubling time. * represents a significant difference as explained in “Materials and methods” section. (G–I) The change in calculated survival fraction as a function of relative growth. A crossover indicates return to control growth. (A, D) HeLa doubling time is estimated from the control curve ( h), where the SF was calculated from a delay time estimated at a relative growth of 2.25. (B, E) FBs () had a delay time estimated from a relative growth of 1.65, from which the SF was calculated. (D, F) CAFs () SF was calculated from a delay time estimated from a relative growth of 1.36. Experiments were repeated three times and the data presented is the average. The error bars represent standard deviation.

