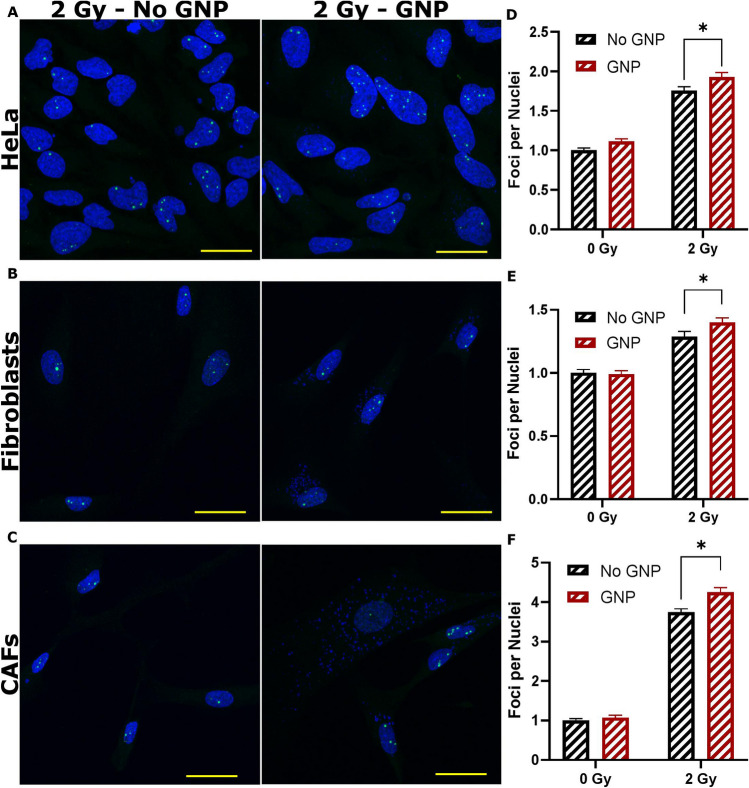
Figure 6.
Immunofluorescence assay using 53BP1 foci. (A-C) Image panels of the three cell lines with 0 Gy and 2 Gy doses, and with or without GNPs. The nuclei are marked in blue while 53BP1 are marked in green. The green dots present in the nuclei are the foci, while the excess staining seen outside the nuclei is a non-specific fluorescence signal. (D-F) Quantitative data of the number of foci per nuclei, gathered from a minimum 50 cells. * represents a significant difference as described in “Materials and methods” section. Further images are available in Supplement S6A–C. Experiments were repeated three times and the data presented is the average. The error bars represent standard error. Scale bar = 20 µm.

