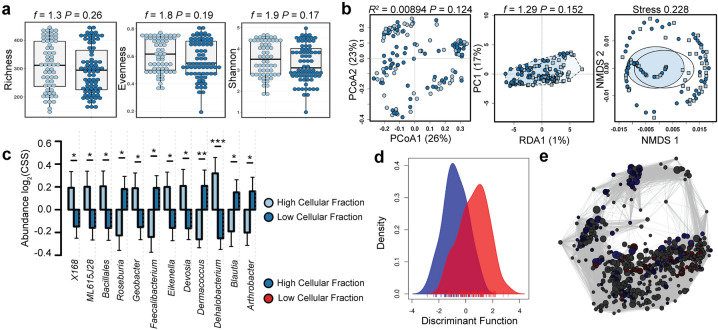
Figure 6.
The closed eye microbiome is unaltered by the cellular fraction at baseline. (a) The alpha diversity is similar as quantified by the richness (t-test, f = 1.3, P = 0.26), evenness (t-test, f = 1.8, P = 0.19) or Shannon diversity (t-test, f = 1.9, P = 0.17) indices. (b) The beta diversity of the closed eye microbiome is unaltered by the cellular fraction as quantified by principal coordinate analysis (PCoA) of Bray–Curtis dissimilarity (PERMANOVA, R2 = 0.00894 P = 0.124), redundancy analysis (RDA, variance = 4.82, f = 1.29, P = 0.152) and non-metric multidimensional scaling (NMDS, stress = 0.228). (c) Relative abundance of bacterial genera. Log2(CSS), log2-transformation of cumulative-sum scaling. Two-way ANOVA, *P = 0.05, **P = 0.01, ***P = 0.001. (d) Discriminant analysis of principal components. (e) Spearman network analysis at the operational taxonomic unit level. Positive correlations with a P value < 0.05 are shown as an edge with the relative size determined by the importance of the taxa to the network.

