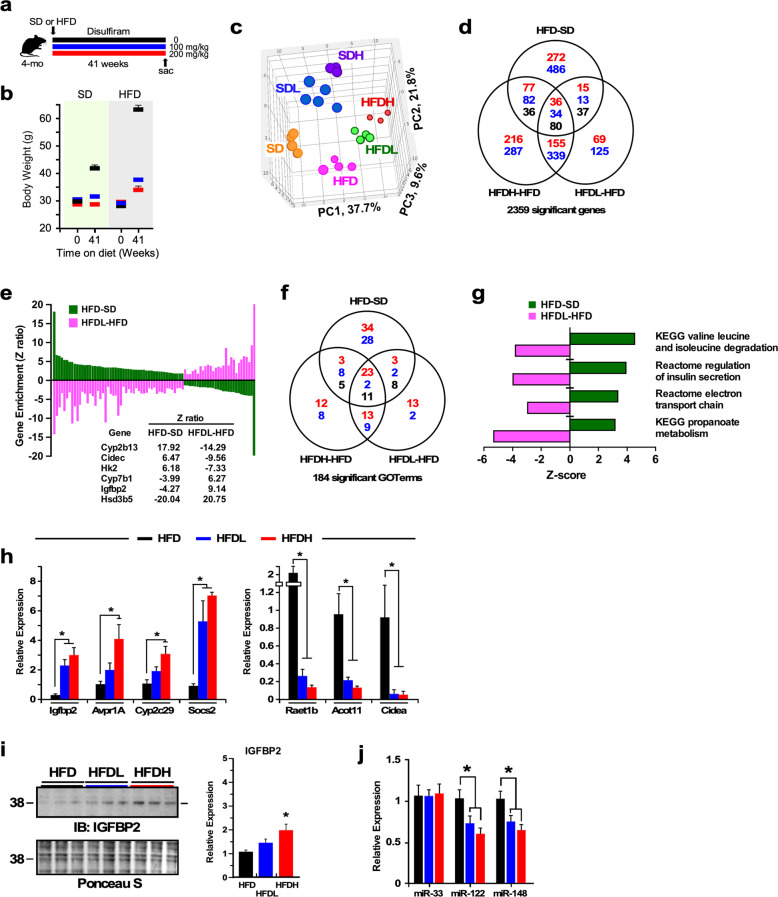
Fig. 1. Disulfiram significantly modifies the liver transcriptome profile in HFD-fed mice.
a Experimental design. Vehicle, black bar; low dose of DSF, blue bar; high dose of DSF, red bar. b Body weight of the six experimental groups of animals at the start and the conclusion of the study. n = 14–22 per group. c Principal component analysis (PCA) was performed on liver of mice fed a standard (SD) or high-fat diet (HFD) supplemented or not with low and high doses of DSF for 41 weeks. d Venn diagram of significantly upregulated (red font), downregulated (blue font), and reciprocally regulated (black font) gene transcripts. e Graphical representation of the 80 genes reciprocally regulated in the HFD-SD, HFDL-HFD, and HFDH-HFD (data not shown) pairwise comparisons. Cyp2b13, Cidec, Hk2, Cyp7b1, Igfbp2, and Hsd3b5 were among the top reciprocally regulated liver genes. Additional information is provided in Supplemental Table 3. f Venn diagram depicting the distribution of GO Terms with positive (red font) and negative (blue font) z-ratios derived from the HFD-SD, HFDL-HFD, and HFDH-HFD pairwise comparisons. The number of GO Terms in black represents z-ratios in opposite direction between the three pairwise comparisons. g A select group of canonical pathways enriched in genes significantly impacted in the HFD-SD and HFDL-HFD pairwise comparisons. h Validation of the microarray data by quantitative real-time PCR. n = 4. i Liver extracts were prepared from mice after 41 weeks of dietary intervention and then immunoblotted for IGFBP2 (left panel). Relative protein expression after data normalization using Ponceau S staining of the membrane is depicted in right panel. Data in f, g are shown as mean ± SEM. *P ≤ 0.05 compared with diet without DSF. Related to Supplementary Fig. 1 and Supplementary Tables 1–3 and 6.

