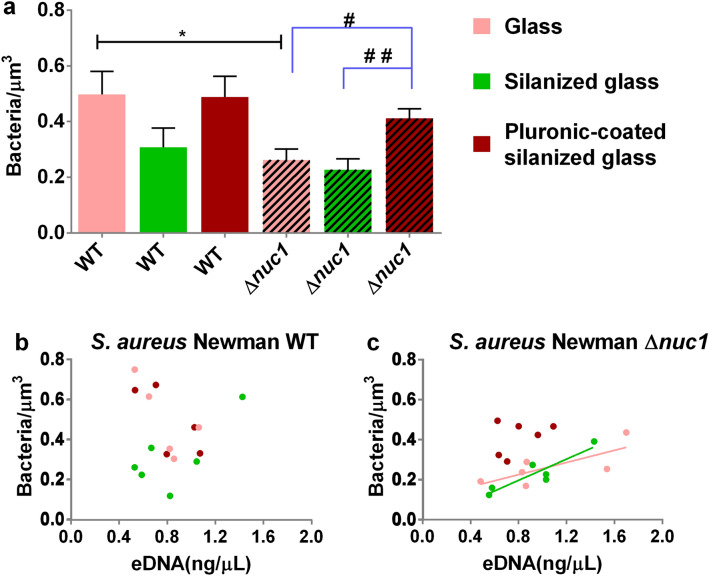
Figure 4.
Evaluation of substrate surface chemistry and Nuc1 production on biofilm properties. (a) Bacterial density of 20 h biofilms grown by S. aureus Newman WT and S. aureus Newman ∆nuc1 on glass, silanized glass and Pluronic F-127-coated silanized glass Bars represent the mean of six biofilms grown with 3 different bacterial cultures. Error bars are the standard error of the mean. Statistical significance between biofilms formed by WT and mutant strain on identical surfaces are indicated with asterisks, *P ≤ 0.05. Statistical significance between biofilms formed on different substrates by identical strains are indicated with hashtags, #P ≤ 0.05; ##P ≤ 0.01. (b), (c) Bacterial density as a function of eDNA concentration in biofilm. Lines indicate a significant correlation between uncleaved eDNA content and biofilm density on glass and silanized glass based on a Pearson correlation test. Dots represent eDNA concentration/density data pairs from the same sample.

