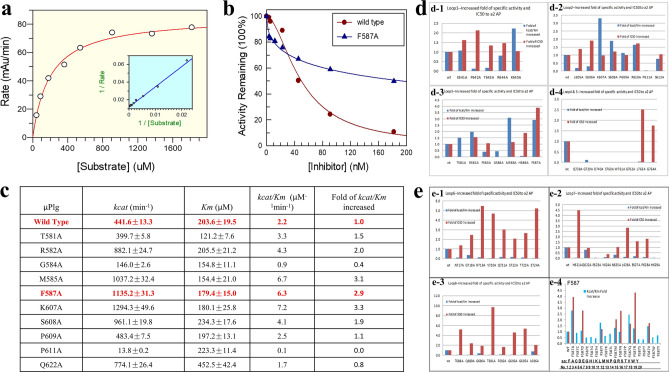
Figure 5.
Kinetics and α2-AP inhibition. (a) An example of Michealis–Menten kinetic measurement of wild-type µPlm. (b) Comparison of α2-AP inhibition of wild-type and F587A, shows the reduced inhibition of F587A by α2-AP. (c) Kinetic parameters of loop 2 and 3 alanine mutants, showed the increased catalytic efficiency (Kcat/Km) of F587A. (d) Kinetic parameters and α2-AP inhibition of loops 1–5. Blue bars represent fold of catalytic efficiency, and the red bars represent fold of IC50 relative to the wild-type. (d-1) loop 1; (d-2) loop 2; (d-3) loop 3; (d-4) loops 4 and 5. (e) Same as (d), with loops 6–8 and F587 saturation mutants. (e-1) Loop 6; (e-2) loop 7; (e-3) loop 8; (e-4) F587 saturation mutants, including all 20 amino acid changes.

